MA Distance MonitorMA Distance Monitor - Custom
Overview
The MA Distance Monitor is a professional-grade dashboard designed for traders who need to track the relationship between price and multiple Moving Averages simultaneously.
Unlike standard indicators that simply plot lines, this tool quantifies exactly how far the price is from your key levels (in Percentage or Price terms). This is crucial for identifying Mean Reversion opportunities (when price is overextended) and confirming Trend Strength.
Key Features
1. 5 Fully Configurable Moving Averages
Monitor 5 distinct MAs at once.
Default Setup: 5, 10, 20, 50, and 200 SMA (Simple Moving Average) — widely used institutional levels.
Customization: Switch any individual MA between SMA and EMA (Exponential Moving Average) and change lengths to fit your strategy.
2. Smart Dashboard (Clean Mode by Default)
The on-screen table gives you real-time data without cluttering your chart.
Clean Mode: By default, it shows only the Distance %, giving you a minimalist view of market extension.
Expandable: In the settings, you can enable additional columns to see the MA Name, MA Price, and Warning Thresholds.
Borders: Toggle table grid lines on or off for a seamless look.
3. "Overextended" Warning System
Set a specific "Warn %" threshold for each MA (e.g., 5%).
If the price deviates beyond this threshold, the indicator highlights the data in Orange (or your custom color).
Use Case: This helps identify when price has moved too far, too fast, signaling a potential pullback or reversal.
4. Chart Scale Labels
Floating labels appear on the right-side price scale, marking the exact price level of your MAs.
These labels dynamically show the current distance %, keeping your eyes on the price action.
5. Advanced Theming
Dark Mode: High-contrast colors optimized for dark charts.
Light Mode: Optimized for bright backgrounds.
Custom: Fully control every color (Bullish, Bearish, Warning, Text, Headers, Borders) to match your chart aesthetic perfectly.
How to Use
Interpreting the Data
Green: Price is Above the Moving Average (Bullish Trend).
Red: Price is Below the Moving Average (Bearish Trend).
Orange (Warning): Price is Overextended (Distance > Threshold). Watch for mean reversion.
Settings Guide
MA Configuration: Set your Lengths and Types (SMA/EMA).
Display & Styling: * Toggle Show Dashboard Table to hide/view the table.
Toggle Show Table Header or Show Table Borders for layout preference.
Enable Show MA Name or Show MA Price for more detailed data.
Colors: Select "Custom" in the Theme dropdown to apply your own color palette.
Alerts
This script includes built-in alertcondition events for automation:
Crossover: Triggered when Price crosses OVER a specific MA.
Crossunder: Triggered when Price crosses UNDER a specific MA.
To set an alert:
Click the "Alert" button in TradingView.
Select "MA Dist Custom" as the condition.
Choose the specific crossing event (e.g., "Cross Over MA 5").
Created by Psycholfye
In den Scripts nach "key levels" suchen

Custom ORBIT GSK-VIZAG-AP-INDIA🚀 Custom ORBIT — Opening Range Breakout & Reversal Indicator
This indicator automatically calculates and plots the Opening Range (OR) high and low levels for a user-defined session and duration. It is designed to assist intraday traders by providing immediate visual signals for both price breakouts and subsequent reversals from these key levels.
The indicator is particularly suitable for markets with defined trading hours, such as the Indian indices (Nifty, Bank Nifty), given its default time settings are based on GMT+5:30.
⚙️ How It Works (Indicator Logic)
The indicator operates based on three main logical components: time definition, level calculation, and signal generation.
1. Time Session and Range Definition: All time calculations are based on GMT+5:30 (Indian Standard Time/IST). The script defines a specific trading session from a customizable start time (default 9:15 AM) to a session end time (default 3:30 PM). The Opening Range (OR) is established during the initial duration, which is set by the rangeMinutes input (default 15 minutes, meaning the OR is calculated from 9:15 AM to 9:30 AM).
2. Level Calculation and Plotting: During the initial range duration, the script captures the absolute highest price (OR High) and the absolute lowest price (OR Low). Once this period ends, two horizontal lines—a green line for the OR High and a red line for the OR Low—are drawn and automatically extended across the chart for the remainder of the active trading session. The visual style of these lines can be customized to Dotted, Dashed, or Solid.
3. Breakout and Reversal Logic: The indicator actively tracks the market's state relative to the OR levels to generate four distinct signals:
Break Up: A signal is generated when the closing price crosses over the OR High, indicating potential upward momentum.
Break Down: A signal is generated when the closing price crosses under the OR Low, indicating potential downward momentum.
Reversal Down: This yellow signal occurs only after a price has already broken above the OR High (Break Up state), and then the price moves back into the range (closing below the ORH), suggesting a failed breakout.
Reversal Up: This yellow signal occurs only after a price has already broken below the OR Low (Break Down state), and then the price moves back into the range (closing above the ORL), suggesting a failed breakdown.
💡 Suggested Use Cases
The signals generated by this indicator can be used in two primary ways:
Breakout Trading: A trader may enter a long position on a "Break Up" signal or a short position on a "Break Down" signal. A common risk management practice is to use the opposite OR level (ORL for long trades, ORH for short trades) as a stop-loss reference.
Faded Breakout / Reversal Trading: Look for the yellow "Reversal Up" or "Reversal Down" signals. These signals indicate a rejection of the OR level, and a trader may take a counter-trend position with the expectation that the price will return to the consolidation range or move toward the opposite OR level.
⚠️ Educational Disclaimer
This indicator is for educational and illustrative purposes only. It provides technical signals based on mathematical calculation of price action and should not be construed as financial advice, trading advice, or a solicitation to buy or sell any financial instrument. Trading carries a high level of risk, and you may lose more than your initial deposit. Past performance is not indicative of future results. Always consult with a qualified financial professional before making any investment decisions.

On Balance Volume [BrightSideTrading]
# On Balance Volume - Complete User Guide
## Overview
This enhanced OBV indicator provides clean, actionable volume analysis with intelligent signal filtering. It combines On-Balance Volume (OBV) with a smoothed signal line to identify shifts in buying and selling pressure without chart clutter.
**Key Features:**
- Real-time OBV and signal line visualization
- Smart crossover detection with confirmation filtering
- Z-Score momentum analysis
- Customizable signal alerts with V-shaped markers
- Window-normalized option for detrended analysis
---
## What is On-Balance Volume (OBV)?
OBV is a volume-based momentum indicator that accumulates volume on up days and subtracts volume on down days. It answers a fundamental question: **Is volume flowing in (buying) or out (selling)?**
**Formula:**
- If Close > Previous Close: OBV = Previous OBV + Volume
- If Close < Previous Close: OBV = Previous OBV - Volume
- If Close = Previous Close: OBV = Previous OBV (unchanged)
**What it tells you:**
- **Rising OBV** = Accumulation (smart money buying)
- **Falling OBV** = Distribution (smart money selling)
- **OBV above zero line** = Net positive buying pressure
- **OBV below zero line** = Net negative selling pressure
---
## Interface & Settings
### **MAIN VISUALIZATION**
**OBV Line (Green/Red Ribbon)**
- Green when OBV is above the signal line (bullish trend)
- Red when OBV is below the signal line (bearish trend)
- Toggles between window-normalized (detrended) and raw values
**Signal Line (Orange)**
- Smoothed average of OBV
- Crossovers with OBV generate buy/sell signals
- Default: 21-period SMA
**V-Shaped Markers**
- Green upward V = Bullish crossover (buy signal)
- Red downward V = Bearish crossover (sell signal)
- Appears at the OBV value when signal is triggered
**Zero Line (Yellow)**
- Center equilibrium point for volume balance
- Acts as support/resistance for OBV
- Separates buying pressure (above) from selling pressure (below)
---
### **SOURCE GROUP**
**Source**
- **Default:** Close
- **Options:** Open, High, Low, or any custom value
- Controls which price value triggers OBV direction changes
- Most traders use Close for standard OBV calculation
---
### **SIGNAL SMOOTHING GROUP**
**Show Signal?**
- **Default:** ON
- Toggle visibility of the signal line
- Disable if you prefer to see raw OBV only
**Smoothing Type**
- **SMA (Simple Moving Average)** - Default, standard smoothing
- **EMA (Exponential Moving Average)** - Faster response, weights recent bars more heavily
- **Choose SMA** for consistent, traditional OBV signals
- **Choose EMA** for faster trend identification (more whipsaws possible)
**Smoothing Length**
- **Default:** 21 bars
- **Range:** 1-200 bars
- **Lower values** (5-14): Faster signals, more noise
- **Higher values** (30-50): Slower signals, fewer false alarms
- **Recommendation:** Use 21-25 for most timeframes
---
### **SIGNAL FILTERING GROUP**
This is your primary control for signal quality and frequency.
**Show Signal Markers?**
- **Default:** ON
- Toggle the V-shaped buy/sell markers on/off
- Disable if markers distract from your analysis
**Signal Filter Type**
- **None** - Shows every single crossover (noisy, best for skilled traders)
- **Confirmation Bars** - Waits N bars before confirming signal (recommended)
- **Strength-Based** - Only signals during strong momentum (filters weakest moves)
#### **CONFIRMATION BARS MODE** (Recommended)
Best for reducing false signals while staying responsive to real moves.
**Confirmation Bars**
- **Default:** 2 bars
- **Range:** 1-10 bars
- Waits for the signal to hold for N consecutive bars after crossover
- **Setting 1:** Every crossover (same as "None")
- **Setting 2:** Wait 1 bar confirmation (good balance)
- **Setting 3:** Wait 2 bars confirmation (filters 50% of noise)
- **Setting 4+:** Very selective, misses quick reversals
**How it works:**
1. OBV crosses signal line → Confirmation counter starts
2. If OBV stays on correct side for 2 bars → V-marker appears
3. If OBV crosses back → Counter resets, no signal
#### **STRENGTH-BASED MODE**
Only signals when momentum is statistically significant.
**Min Z-Score Strength**
- **Default:** 0.3
- **Range:** 0.0-3.0
- Requires OBV deviation from its mean to reach this threshold
- **Setting 0.1-0.3:** More signals, lower quality
- **Setting 0.5-0.8:** Moderate signals, good quality
- **Setting 1.0+:** Only the strongest momentum shifts
**How it works:**
- Calculates how far OBV is from its 50-bar average (Z-score)
- Only shows signals when this distance is meaningful
- Automatically avoids weak, choppy market conditions
---
### **VISUALS & COLORS GROUP**
**Highlight Crossovers?**
- **Default:** ON
- Master toggle for all signal markers
- Turn OFF to see only the OBV/signal lines
**Apply Ribbon Filling?**
- **Default:** ON
- Colors the space between OBV and signal line
- Green fill = OBV above signal (bullish)
- Red fill = OBV below signal (bearish)
- Provides clear visual trend confirmation
- Turn OFF for minimal chart clutter
---
### **STATS & ZONES GROUP**
**Use Window-Normalized OBV (visual only)?**
- **Default:** ON
- Removes long-term trend from OBV for clearer short-term signals
- Detrends the indicator to highlight recent momentum changes
- **ON:** Better for swing trading and identifying reversals
- **OFF:** Better for trend-following strategies
- Note: Z-Score always uses raw OBV for statistical accuracy
**OBV Normalize Window**
- **Default:** 200 bars
- Lookback period for detrending calculation
- Larger values = more aggressive detrending
- Adjust if you want OBV to oscillate more/less around zero
**Show Z-Score (OBV)?**
- **Default:** ON
- Displays statistical momentum indicator below main chart
- Ranges from -3 to +3 (most data within -2 to +2)
- High Z-Score = Strong buying momentum
- Low Z-Score = Strong selling momentum
**Z-Score Lookback**
- **Default:** 50 bars
- Period for calculating Z-Score mean and standard deviation
- Larger = smoother Z-Score, slower response
- Smaller = noisier Z-Score, faster response
**Show ROC (OBV Momentum)?**
- **Default:** OFF
- Rate of Change indicator for OBV velocity
- Useful for identifying momentum turning points
- Enable if you want to see speed of volume changes
**ROC Lookback**
- **Default:** 14 bars
- Period for ROC calculation
**Show Z-Score StdDev Zones?**
- **Default:** ON
- Shaded regions around zero line showing statistical boundaries
- Inner Zone (±1 Z) = Normal variation
- Outer Zone (±2 Z) = Extreme moves, potential reversals
- Helps identify overbought/oversold volume conditions
**Inner Zone (±Z)**
- **Default:** 1.0
- First boundary for standard deviation zones
- Most normal trading occurs within ±1
**Outer Zone (±Z)**
- **Default:** 2.0
- Second boundary for extreme conditions
- Crossing these zones indicates significant momentum shift
---
## Trading Strategy Examples
### **Strategy 1: Signal Line Crossovers (Beginner)**
**Setup:**
- Signal Filter Type: **Confirmation Bars**
- Confirmation Bars: **2-3**
- Show Signal Markers: **ON**
**Rules:**
1. **BUY signal** (green V): When OBV crosses above signal line and holds for 2-3 bars
- Confirms buying pressure is building
- Look for price to follow within 1-3 bars
2. **SELL signal** (red V): When OBV crosses below signal line and holds for 2-3 bars
- Confirms selling pressure is increasing
- Expect price decline
3. **Exit:** Take profits at next signal or use price support/resistance
**Best For:** Swing trading, intraday reversals, timeframes 5m-1h
---
### **Strategy 2: Zero Line Bounce (Intermediate)**
**Setup:**
- Signal Filter Type: **Strength-Based**
- Min Z-Score Strength: **0.5**
- Show Z-Score StdDev Zones: **ON**
**Rules:**
1. **Watch OBV approach zero line** during established trends
- OBV bouncing repeatedly off zero = trend is healthy
- OBV breaking through zero = trend reversal imminent
2. **Enter on bounce:** Buy when OBV bounces from zero line in uptrend
3. **Exit on break:** Close position when OBV breaks below zero line
4. **Confirm with Z-Score:** Only take trades when Z-Score shows momentum (|Z| > 0.5)
**Best For:** Trend traders, identifying trend strength, medium timeframes 15m-4h
---
### **Strategy 3: Momentum Extremes (Advanced)**
**Setup:**
- Signal Filter Type: **None**
- Show Z-Score StdDev Zones: **ON**
- Outer Zone: **2.0**
**Rules:**
1. **Identify extremes:** When Z-Score breaks outer zone (±2.0)
- Indicator is in extreme territory
- Likely overextended
2. **Fade extremes:** Take opposite position when Z-Score hits extreme
- High Z (>2.0) = OBV overbought, expect pullback
- Low Z (<-2.0) = OBV oversold, expect bounce
3. **Confirm:** Wait for crossover signal to enter
4. **Target:** Outer zone of opposite side or zero line
**Best For:** Range trading, mean reversion, experienced traders only
---
## Reading the Indicator in Different Markets
### **Strong Uptrend**
- OBV consistently above signal line (green)
- OBV well above zero line, rising higher lows
- Z-Score positive, trending upward
- **Action:** Buy dips to signal line, sell at resistance
### **Strong Downtrend**
- OBV consistently below signal line (red)
- OBV well below zero line, making lower highs
- Z-Score negative, trending downward
- **Action:** Sell rallies to signal line, cover at support
### **Consolidation/Choppy Market**
- OBV whipsaws around signal line frequently
- Crossovers occur every few bars
- Z-Score oscillating between -1 and +1
- **Action:** Increase confirmation bars to 3-4, or switch to strength-based filter
### **Accumulation (Bottom Formation)**
- OBV rising while price is flat or falling
- Volume flowing in despite downtrend (bullish divergence)
- Z-Score climbing while price lows hold
- **Action:** Expect breakout up; prepare buy near support
### **Distribution (Top Formation)**
- OBV falling while price is flat or rising
- Volume flowing out despite uptrend (bearish divergence)
- Z-Score falling while price continues higher
- **Action:** Expect breakdown down; prepare short near resistance
---
## Parameter Tuning Guide
### **Aggressive Settings (More Signals)**
- Smoothing Length: 14
- Signal Filter: None or Confirmation Bars: 1
- Min Z-Score: 0.1
- Best for: Day trading, high volatility stocks
- Risk: More false signals
### **Balanced Settings (Recommended)**
- Smoothing Length: 21
- Signal Filter: Confirmation Bars: 2
- Min Z-Score: 0.3
- Best for: Swing trading, most market conditions
- Risk/Reward: Moderate
### **Conservative Settings (Fewer Signals)**
- Smoothing Length: 30-40
- Signal Filter: Confirmation Bars: 3-4 or Strength-Based: 0.7+
- Min Z-Score: 0.8
- Best for: Position trading, high-conviction trades only
- Risk: May miss some moves
---
## Common Questions & Troubleshooting
**Q: Why are there more sell signals than buy signals?**
A: This reflects the actual market action. Markets often decline faster than they rise (fear > greed). Confirm signals with price action and support/resistance.
**Q: The indicator keeps whipsawing, should I hide it?**
A: Increase Confirmation Bars to 3-4 or switch to Strength-Based filter. Market conditions matter—choppy markets require stricter filters.
**Q: What's the difference between normalized and raw OBV?**
A: Normalized (detrended) shows shorter-term momentum by removing long-term trends. Raw OBV shows absolute accumulation/distribution over the full period. Use normalized for swing signals, raw for trend confirmation.
**Q: My signals come too late. How do I get faster entry?**
A: Reduce Smoothing Length (try 14 instead of 21), use EMA instead of SMA, or set Confirmation Bars to 1. Trade-off: More false signals.
**Q: Can I use this for day trading?**
A: Yes, on 1m-5m charts with aggressive settings. Use Confirmation Bars: 1 and focus on Z-Score > 0.5 entries only.
**Q: Should I trade every signal?**
A: No. Filter signals using: price near support/resistance, multiple indicators confirming, and Z-Score showing momentum. Best signals occur at key levels.
---
## Best Practices
1. **Always confirm with price action:** OBV signals work best when price is near support, resistance, or moving average. Don't trade signals in a vacuum.
2. **Use volume context:** Check if volume is increasing or decreasing on the signal. Strong signals have volume confirmation (increasing volume on OBV spikes).
3. **Adjust settings per timeframe:**
- 1m-5m: Smoothing 12, Confirmation 1, Z-Score 0.2
- 15m-1h: Smoothing 20, Confirmation 2, Z-Score 0.3
- 4h-1d: Smoothing 25, Confirmation 3, Z-Score 0.5
4. **Watch the zero line:** It's your friend. OBV behavior at the zero line reveals trend strength. Bounces = healthy trend. Breaks = reversal.
5. **Risk management:** No indicator is perfect. Use proper position sizing and stop losses. OBV should confirm your thesis, not be the only reason to trade.
6. **Combine with other indicators:**
- Price moving averages for trend confirmation
- RSI or Stochastic for overbought/oversold levels
- Support/resistance for entry/exit zones
- MACD for momentum divergences
---
## Disclaimer
This indicator is for educational and informational purposes only. It is not financial advice. Past performance does not guarantee future results. Always conduct your own research and consult with a financial advisor before making trading decisions. Trading carries risk, including potential loss of principal.
---
## Version History
**Version 1.0** - Initial release with enhanced signal filtering, Z-Score analysis, and customizable parameters.

Liquidity Structure & Sweeps [Visualized]Liquidity Structure & Sweeps | 流动性结构与猎杀
1. Design Philosophy & Logic
This indicator is designed based on Smart Money Concepts (SMC) and Market Microstructure principles. Unlike traditional indicators that rely on lagging averages or repainting fractals, this script focuses on "Objective Structure" and "Liquidity Grabs".
The core design philosophy rests on three pillars:
Zero Repainting (Real-time Integrity): We utilize a strict "Left-Side Confirmation" algorithm. A structure level is only stored in memory when the candle is fully closed (barstate.isconfirmed). This ensures that the historical signals you see are exactly what happened in real-time.
Institutional Memory (Visualized): Markets "remember" key levels. This script draws dashed lines extending from valid pivot points. These lines represent "resting liquidity" (Stop Orders). They remain on the chart until the price interacts with them.
Sweep vs. Breakout: Not all breaches are equal. We specifically look for "Sweeps" (Liquidity Grabs) — where price pierces a level but closes back inside. This is a classic sign of absorption and potential reversal, distinct from a structural breakout.
2. Key Features
Visualized Order Blocks: Automatically draws potential support (Green Dotted) and resistance (Red Dotted) lines based on fractal points.
Wick Detection: Filters out strong momentum breakouts. Signals are only generated when a specific "Wick Ratio" is met, indicating a rejection.
Clean Charts: Features a "Garbage Collection" mechanism. Once a level is swept, the line is removed, and a signal dot is placed. Old, untouched levels are automatically cycled out to prevent chart clutter.
3. How to Use
The Lines (Context):
Red Dotted Line: Buy-side Liquidity (Resistance). Expect potential shorts or breakouts here.
Green Dotted Line: Sell-side Liquidity (Support). Expect potential longs or breakdowns here.
The Signals (Action):
Red Dot (Bearish Sweep): Price spiked above a Resistance Line but closed below it. This suggests long stops were hunted, and bears are stepping in.
Green Dot (Bullish Sweep): Price spiked below a Support Line but closed above it. This suggests short stops were hunted, and bulls are stepping in.
Configuration:
Structure Length: Adjusts sensitivity. Higher values (e.g., 20-50) find major swing points; lower values (e.g., 5-10) find scalping setups.
Wick Filter %: The minimum size of the wick relative to the breakout. Increase this to filter for only the most dramatic rejections.
4. Developer Notes & Considerations
Why do lines disappear? In this logic, liquidity is treated as "Fuel". Once a level is swept (the stop orders are triggered), the fuel is consumed. Keeping the line would clutter the chart with invalid data.
Why is the dot small? The indicator is designed to be part of a toolchain, not a standalone signal. The minimalist design prevents visual interference with price action or other indicators.
1. 设计思路与核心逻辑
本指标基于 聪明钱概念 (SMC) 与 市场微观结构 原理设计。不同于依赖滞后均线或存在重绘问题的传统分形指标,本脚本专注于捕捉 “客观结构” 与 “流动性猎杀 (Liquidity Grabs)”。
核心设计哲学包含三大支柱:
零重绘 (Zero Repainting): 我们采用了严格的“左侧确认”算法。所有的结构位仅在K线完全收盘 (barstate.isconfirmed) 后才会被记录。这保证了您回测看到的信号与实盘完全一致,杜绝“未来函数”陷阱。
可视化的机构记忆: 市场是有记忆的。本脚本会从有效的波段高低点引出虚线。这些虚线代表了“沉睡的流动性”(止损盘聚集区)。它们会一直延伸,直到价格触碰它们。
区分“猎杀”与“突破”: 并不是所有的破位都是一样的。我们专注于识别“扫损(Sweep)”——即价格刺破了关键位,但收盘价收回了关键位内部。这是典型的吸筹或派发信号,与趋势延续的真突破有本质区别。
2. 主要功能
结构可视化: 自动基于分形点绘制潜在的支撑线(绿色虚线)和阻力线(红色虚线)。
插针检测: 过滤掉强势的实体突破。只有当价格出现明显的“长影线”拒绝行为时,才会触发信号。
图表自清洁: 内置“垃圾回收”机制。一旦某个关键位的流动性被猎杀(触发信号),该线条会被自动删除。过旧且未被触碰的线条也会被自动替换,保持图表整洁。
3. 使用指南
线条 (市场语境):
红色虚线: 买方流动性池(阻力位)。
绿色虚线: 卖方流动性池(支撑位)。
信号点 (交易动作):
红色圆点 (看跌猎杀): 价格刺破了红色阻力线,但收盘价回落到线下方。这暗示多头止损被触发,主力可能正在建立空单。
绿色圆点 (看涨猎杀): 价格刺破了绿色支撑线,但收盘价反弹到线上方。这暗示空头止损被触发,主力可能正在建立多单。
参数设置建议:
Structure Length (结构周期): 调整灵敏度。数值越大(如 20-50)锁定大级别波段;数值越小(如 5-10)适合短线剥头皮。
Wick Filter % (影线过滤): 设置影线占价格波动的最小比例。调大该数值可以只看最剧烈的反转信号。
4. 开发者注记与潜在考量
为什么线条会消失? 在本逻辑中,流动性被视为“燃料”。一旦发生猎杀(止损单成交),该位置的燃料即被消耗。移除线条是为了防止无效数据干扰判断。
为什么圆点设计得很小? 该指标旨在成为您交易工具链的一部分,而非唯一的决策依据。极简设计是为了避免干扰裸K形态或其他指标的观察。
===============================================================
这个脚本(我们称之为 Liq Structure Script)本质上是一个基于价格行为(Price Action)的结构猎杀探测器。
以下是详细的深度对比分析:
1. 如何使用? (实战操作手册)
不要把它当作“红灯停绿灯行”的傻瓜指标。把它当作一个**“战场地图”**。
第一阶段:观察结构 (The Setup)
图表上会自动画出 红色虚线(上方压力)和 绿色虚线(下方支撑)。
解读:告诉自己,“这里埋着很多人的止损单”。不要在这里盲目追涨杀跌。
第二阶段:等待猎杀 (The Trigger)
耐心等待价格冲向这些虚线。
关键动作:价格刺破虚线,然后迅速收回。
信号确认:虚线消失,留下一个 红点(顶部猎杀)或 绿点(底部猎杀)。
第三阶段:进场逻辑 (The Execution)
做空逻辑:出现红点 + K线留长上影线 → 说明多头试图突破失败,被主力“倒了一盆冷水”。此时可尝试做空,止损设在刚刚那个最高点上方一点点。
做多逻辑:出现绿点 + K线留长下影线 → 说明空头试图砸盘失败,被主力接住了。
传统爆量是“燃料”,Liq 脚本是“引爆点”。没有引爆点的爆量可能是空转;没有爆量的引爆点可能是假摔。Liq 脚本是一个免费、轻量级、基于K线逻辑的替代品。它不需要你买昂贵的数据服务,它利用的是“图表形态学”中的流动性共识。
结论:如何定位这个工具?
这个脚本不是“预测未来的水晶球”,而是一个**“高胜率区域提示器”**。
用它来找位置(哪里有陷阱?)。
用成交量来做确认(是不是真的有主力介入?)。
用宏观逻辑来定方向(现在该做多还是做空?)。
它是你交易工具链中负责**“微观入场时机(Timing)”**的那一环。

Scout Regiment - KSI# Scout Regiment - KSI Indicator
## English Documentation
### Overview
Scout Regiment - KSI (Key Stochastic Indicators) is a comprehensive momentum oscillator that combines three powerful technical indicators - RSI, CCI, and Williams %R - into a single, unified display. This multi-indicator approach provides traders with diverse perspectives on market momentum, overbought/oversold conditions, and potential reversal points through advanced divergence detection.
### What is KSI?
KSI stands for "Key Stochastic Indicators" - a composite momentum indicator that:
- Displays multiple oscillators normalized to a 0-100 scale
- Uses standardized bands (20/50/80) for consistent interpretation
- Combines RSI for trend, CCI for cycle, and Williams %R for reversal detection
- Provides enhanced divergence detection specifically for RSI
### Key Features
#### 1. **Triple Oscillator System**
**① RSI (Relative Strength Index)** - Primary Indicator
- **Purpose**: Measures momentum and identifies overbought/oversold conditions
- **Default Length**: 22 periods
- **Display**: Blue line (2px)
- **Key Levels**:
- Above 50: Bullish momentum
- Below 50: Bearish momentum
- Above 80: Overbought
- Below 20: Oversold
- **Special Features**:
- Background color indication (green/red)
- Crossover labels at 50 level
- Full divergence detection (4 types)
**② CCI (Commodity Channel Index)** - Dual Period
- **Purpose**: Identifies cyclical trends and extreme conditions
- **Dual Display**:
- CCI(33): Short-term cycle - Green line (1px)
- CCI(77): Medium-term cycle - Orange line (1px)
- **Default Source**: HLC3 (typical price)
- **Normalized Scale**: Mapped from ±100 to 0-100 for consistency
- **Interpretation**:
- Above 80: Strong upward momentum
- Below 20: Strong downward momentum
- 50 level: Neutral
- Divergence between periods: Trend change warning
**③ Williams %R** - Optional
- **Purpose**: Identifies overbought/oversold extremes
- **Default Length**: 28 periods
- **Display**: Magenta line (2px)
- **Scale**: Inverted and normalized to 0-100
- **Best For**: Short-term reversal signals
- **Default**: Disabled (enable when needed for extra confirmation)
#### 2. **Standardized Band System**
**Three-Level Structure:**
- **Upper Band (80)**: Overbought zone
- Strong momentum area
- Watch for reversal signals
- Divergences here are most reliable
- **Middle Line (50)**: Equilibrium
- Separates bullish/bearish zones
- Crossovers indicate momentum shifts
- Key decision level
- **Lower Band (20)**: Oversold zone
- Weak momentum area
- Look for bounce signals
- Divergences here signal potential reversals
**Band Fill**: Dark background between 20-80 for visual clarity
#### 3. **RSI Visual Enhancements**
**Background Color Indication**
- Green background: RSI above 50 (bullish bias)
- Red background: RSI below 50 (bearish bias)
- Optional display for cleaner charts
- Helps identify overall momentum direction
**Crossover Labels**
- "突破" (Breakout): RSI crosses above 50
- "跌破" (Breakdown): RSI crosses below 50
- Marks momentum shift points
- Can be toggled on/off
#### 4. **Advanced RSI Divergence Detection**
The indicator includes comprehensive divergence detection for RSI only (most reliable oscillator):
**Regular Bullish Divergence (Yellow)**
- **Price**: Lower lows
- **RSI**: Higher lows
- **Signal**: Potential upward reversal
- **Label**: "涨" (Up)
- **Most Common**: Near oversold levels (below 30)
**Regular Bearish Divergence (Blue)**
- **Price**: Higher highs
- **RSI**: Lower highs
- **Signal**: Potential downward reversal
- **Label**: "跌" (Down)
- **Most Common**: Near overbought levels (above 70)
**Hidden Bullish Divergence (Light Yellow)**
- **Price**: Higher lows
- **RSI**: Lower lows
- **Signal**: Uptrend continuation
- **Label**: "隐涨" (Hidden Up)
- **Use**: Add to existing longs
**Hidden Bearish Divergence (Light Blue)**
- **Price**: Lower highs
- **RSI**: Higher highs
- **Signal**: Downtrend continuation
- **Label**: "隐跌" (Hidden Down)
- **Use**: Add to existing shorts
**Divergence Parameters** (Fully Customizable):
- **Right Lookback**: Bars to right of pivot (default: 5)
- **Left Lookback**: Bars to left of pivot (default: 5)
- **Max Range**: Maximum bars between pivots (default: 60)
- **Min Range**: Minimum bars between pivots (default: 5)
### Configuration Settings
#### KSI Display Settings
- **Show RSI**: Toggle RSI indicator
- **Show CCI**: Toggle both CCI lines
- **Show Williams %R**: Toggle Williams %R (optional)
#### RSI Settings
- **RSI Length**: Period for calculation (default: 22)
- **Data Source**: Price source (default: close)
- **Show Background**: Toggle green/red background
- **Show Cross Labels**: Toggle 50-level crossover labels
#### RSI Divergence Settings
- **Right Lookback**: Pivot detection right side
- **Left Lookback**: Pivot detection left side
- **Max Range**: Maximum lookback distance
- **Min Range**: Minimum lookback distance
- **Show Regular Divergence**: Enable regular divergence lines
- **Show Regular Labels**: Enable regular divergence labels
- **Show Hidden Divergence**: Enable hidden divergence lines
- **Show Hidden Labels**: Enable hidden divergence labels
#### CCI Settings
- **CCI Length**: Short-term period (default: 33)
- **CCI Mid Length**: Medium-term period (default: 77)
- **Data Source**: Price calculation (default: HLC3)
- **Show CCI(33)**: Toggle short-term CCI
- **Show CCI(77)**: Toggle medium-term CCI
#### Williams %R Settings
- **Length**: Calculation period (default: 28)
- **Data Source**: Price source (default: close)
### How to Use
#### For Basic Momentum Trading
1. **Enable RSI Only** (primary indicator)
- Focus on 50-level crossovers
- Enable crossover labels for signals
2. **Identify Momentum Direction**
- RSI > 50 = Bullish momentum
- RSI < 50 = Bearish momentum
- Background color confirms direction
3. **Look for Extremes**
- RSI > 80 = Overbought (consider selling)
- RSI < 20 = Oversold (consider buying)
4. **Trade Setup**
- Enter long when RSI crosses above 50 from oversold
- Enter short when RSI crosses below 50 from overbought
#### For Divergence Trading
1. **Enable RSI with Divergence Detection**
- Turn on regular divergence
- Optionally add hidden divergence
2. **Wait for Divergence Signal**
- Yellow label = Bullish divergence
- Blue label = Bearish divergence
3. **Confirm with Price Structure**
- Wait for support/resistance break
- Look for candlestick patterns
- Check volume confirmation
4. **Enter Position**
- Enter after confirmation
- Stop beyond divergence pivot
- Target next key level
#### For Multi-Oscillator Confirmation
1. **Enable All Three Indicators**
- RSI (momentum)
- CCI dual (cycle analysis)
- Williams %R (extremes)
2. **Look for Alignment**
- All above 50 = Strong bullish
- All below 50 = Strong bearish
- Mixed signals = Consolidation
3. **Identify Extremes**
- All indicators > 80 = Extreme overbought
- All indicators < 20 = Extreme oversold
4. **Trade Reversals**
- Enter counter-trend when all aligned at extremes
- Confirm with divergence if available
- Use tight stops
#### For CCI Dual-Period Analysis
1. **Enable Both CCI Lines**
- CCI(33) = Short-term
- CCI(77) = Medium-term
2. **Watch for Crossovers**
- Green crosses above orange = Bullish acceleration
- Green crosses below orange = Bearish acceleration
3. **Analyze Divergence Between Periods**
- Short-term rising, medium falling = Potential reversal
- Both rising together = Strong trend
4. **Trade Accordingly**
- Follow crossover direction
- Exit when lines converge
### Trading Strategies
#### Strategy 1: RSI 50-Level Crossover
**Setup:**
- Enable RSI with background and labels
- Wait for clear trend
- Look for retracement to 50 level
**Entry:**
- Long: "突破" label appears after pullback
- Short: "跌破" label appears after bounce
**Stop Loss:**
- Long: Below recent swing low
- Short: Above recent swing high
**Exit:**
- Opposite crossover label
- Or predetermined target (2:1 risk-reward)
**Best For:** Trend following, clear markets
#### Strategy 2: RSI Divergence Reversal
**Setup:**
- Enable RSI with regular divergence
- Wait for extreme levels (>70 or <30)
- Look for divergence signal
**Entry:**
- Long: Yellow "涨" label at oversold level
- Short: Blue "跌" label at overbought level
**Confirmation:**
- Wait for price to break structure
- Check for volume increase
- Look for candlestick reversal pattern
**Stop Loss:**
- Beyond divergence pivot point
**Exit:**
- Take partial profit at 50 level
- Exit remainder at opposite extreme or divergence
**Best For:** Swing trading, range-bound markets
#### Strategy 3: Triple Oscillator Confluence
**Setup:**
- Enable all three indicators
- Wait for all to reach extreme (>80 or <20)
- Look for alignment
**Entry:**
- Long: All three below 20, first one crosses above 20
- Short: All three above 80, first one crosses below 80
**Confirmation:**
- All indicators must align
- Price at support/resistance
- Volume spike helps
**Stop Loss:**
- Fixed percentage or ATR-based
**Exit:**
- When any indicator crosses 50 level
- Or at predetermined target
**Best For:** High-probability reversals, volatile markets
#### Strategy 4: CCI Dual-Period System
**Setup:**
- Enable both CCI lines only
- Disable RSI and Williams %R for clarity
- Watch for crossovers
**Entry:**
- Long: CCI(33) crosses above CCI(77) below 50 line
- Short: CCI(33) crosses below CCI(77) above 50 line
**Confirmation:**
- Both should be moving in entry direction
- Price breaking key level helps
**Stop Loss:**
- When CCIs cross back in opposite direction
**Exit:**
- Both CCIs enter opposite extreme zone
- Or trailing stop
**Best For:** Catching trend continuations, momentum trading
#### Strategy 5: Hidden Divergence Continuation
**Setup:**
- Enable RSI with hidden divergence
- Confirm existing trend
- Wait for pullback
**Entry:**
- Uptrend: "隐涨" label during pullback
- Downtrend: "隐跌" label during bounce
**Confirmation:**
- Price holds key moving average
- Trend structure intact
**Stop Loss:**
- Beyond pullback extreme
**Exit:**
- Regular divergence appears (reversal warning)
- Or trend structure breaks
**Best For:** Adding to positions, trend trading
### Best Practices
#### Choosing Which Indicators to Display
**For Beginners:**
- Use RSI only
- Enable background color and labels
- Focus on 50-level crossovers
- Simple and effective
**For Intermediate Traders:**
- RSI + Regular Divergence
- Add CCI for confirmation
- Use dual perspectives
- Better accuracy
**For Advanced Traders:**
- All three indicators
- Full divergence detection
- Multi-timeframe analysis
- Maximum information
#### Oscillator Priority
**Primary**: RSI (22)
- Most reliable
- Best divergence detection
- Good for all timeframes
- Use this as your main decision maker
**Secondary**: CCI (33/77)
- Adds cycle analysis
- Great for confirmation
- Dual-period crossovers valuable
- Use to confirm RSI signals
**Tertiary**: Williams %R (28)
- Extreme readings useful
- More volatile
- Best for short-term
- Use sparingly for extra confirmation
#### Timeframe Considerations
**Lower Timeframes (1m-15m):**
- More signals, less reliable
- Use tight divergence parameters
- Focus on RSI crossovers
- Quick entries and exits
**Medium Timeframes (30m-4H):**
- Balanced signal frequency
- Default settings work well
- Best for divergence trading
- Swing trading optimal
**Higher Timeframes (Daily+):**
- Fewer but stronger signals
- Widen divergence ranges
- All indicators more reliable
- Position trading best
#### Divergence Trading Tips
1. **Wait for Confirmation**
- Divergence alone isn't enough
- Need price structure break
- Volume helps validate
2. **Best at Extremes**
- Divergences near 80/20 levels most reliable
- Mid-level divergences often fail
- Combine with support/resistance
3. **Multiple Divergences**
- Second divergence stronger than first
- Third divergence extremely powerful
- Watch for "triple divergence"
4. **Timeframe Alignment**
- Check higher timeframe for direction
- Trade divergences in direction of larger trend
- Counter-trend divergences riskier
### Indicator Combinations
**With Moving Averages:**
- Use EMAs (21/55/144) for trend
- KSI for entry timing
- Enter when both align
**With Volume:**
- Volume confirms breakouts
- Divergence + volume divergence = Stronger
- Low volume at extremes = Reversal likely
**With Support/Resistance:**
- Price levels for targets
- KSI for entry timing
- Divergences at levels = Highest probability
**With Bias Indicator:**
- Bias shows price deviation
- KSI shows momentum
- Both diverging = Strong reversal signal
**With OBV Indicator:**
- OBV shows volume trend
- KSI shows price momentum
- Volume/momentum divergence powerful
### Common Patterns
1. **Bullish Reversal**: All oscillators oversold + RSI bullish divergence
2. **Bearish Reversal**: All oscillators overbought + RSI bearish divergence
3. **Trend Acceleration**: RSI > 50, both CCIs rising, Williams %R not extreme
4. **Weakening Trend**: RSI declining while price rising (pre-divergence warning)
5. **Strong Trend**: All oscillators stay above/below 50 for extended period
6. **Consolidation**: Oscillators crossing 50 frequently without extremes
7. **Exhaustion**: Multiple oscillators at extreme + hidden divergence failure
### Performance Tips
- Start simple: RSI only
- Add indicators gradually as you learn
- Disable unused features for cleaner charts
- Use labels strategically (not always on)
- Test different RSI lengths for your market
- Adjust divergence parameters based on volatility
### Alert Conditions
The indicator includes alerts for:
- RSI crossing above 50
- RSI crossing below 50
- RSI regular bullish divergence
- RSI regular bearish divergence
- RSI hidden bullish divergence
- RSI hidden bearish divergence
---
## 中文说明文档
### 概述
Scout Regiment - KSI(关键随机指标)是一个综合性动量振荡器,将三个强大的技术指标 - RSI、CCI和威廉指标 - 组合到一个统一的显示中。这种多指标方法为交易者提供了市场动量、超买超卖状况和通过高级背离检测发现潜在反转点的多元视角。
### 什么是KSI?
KSI代表"关键随机指标" - 一个综合动量指标:
- 显示多个振荡器,标准化到0-100刻度
- 使用标准化波段(20/50/80)便于一致解读
- 结合RSI用于趋势、CCI用于周期、威廉指标用于反转检测
- 专门为RSI提供增强的背离检测
### 核心功能
#### 1. **三重振荡器系统**
**① RSI(相对强弱指数)** - 主要指标
- **用途**:测量动量并识别超买超卖状况
- **默认长度**:22周期
- **显示**:蓝色线(2像素)
- **关键水平**:
- 50以上:看涨动量
- 50以下:看跌动量
- 80以上:超买
- 20以下:超卖
- **特殊功能**:
- 背景颜色指示(绿色/红色)
- 50水平穿越标签
- 完整背离检测(4种类型)
**② CCI(顺势指标)** - 双周期
- **用途**:识别周期性趋势和极端状况
- **双重显示**:
- CCI(33):短期周期 - 绿色线(1像素)
- CCI(77):中期周期 - 橙色线(1像素)
- **默认数据源**:HLC3(典型价格)
- **标准化刻度**:从±100映射到0-100以保持一致性
- **解读**:
- 80以上:强劲上升动量
- 20以下:强劲下降动量
- 50水平:中性
- 周期间背离:趋势变化警告
**③ 威廉指标 %R** - 可选
- **用途**:识别超买超卖极值
- **默认长度**:28周期
- **显示**:洋红色线(2像素)
- **刻度**:反转并标准化到0-100
- **最适合**:短期反转信号
- **默认**:禁用(需要额外确认时启用)
#### 2. **标准化波段系统**
**三层结构:**
- **上轨(80)**:超买区域
- 强动量区域
- 注意反转信号
- 此处的背离最可靠
- **中线(50)**:均衡线
- 分隔看涨/看跌区域
- 穿越表示动量转变
- 关键决策水平
- **下轨(20)**:超卖区域
- 弱动量区域
- 寻找反弹信号
- 此处的背离预示潜在反转
**波段填充**:20-80之间的深色背景,增强视觉清晰度
#### 3. **RSI视觉增强**
**背景颜色指示**
- 绿色背景:RSI在50以上(看涨偏向)
- 红色背景:RSI在50以下(看跌偏向)
- 可选显示,图表更清爽
- 帮助识别整体动量方向
**穿越标签**
- "突破":RSI向上穿越50
- "跌破":RSI向下穿越50
- 标记动量转变点
- 可开关
#### 4. **高级RSI背离检测**
指标仅为RSI(最可靠的振荡器)提供全面背离检测:
**常规看涨背离(黄色)**
- **价格**:更低的低点
- **RSI**:更高的低点
- **信号**:潜在向上反转
- **标签**:"涨"
- **最常见**:在超卖水平附近(30以下)
**常规看跌背离(蓝色)**
- **价格**:更高的高点
- **RSI**:更低的高点
- **信号**:潜在向下反转
- **标签**:"跌"
- **最常见**:在超买水平附近(70以上)
**隐藏看涨背离(浅黄色)**
- **价格**:更高的低点
- **RSI**:更低的低点
- **信号**:上升趋势延续
- **标签**:"隐涨"
- **用途**:加仓现有多头
**隐藏看跌背离(浅蓝色)**
- **价格**:更低的高点
- **RSI**:更高的高点
- **信号**:下降趋势延续
- **标签**:"隐跌"
- **用途**:加仓现有空头
**背离参数**(完全可自定义):
- **右侧回溯**:枢轴点右侧K线数(默认:5)
- **左侧回溯**:枢轴点左侧K线数(默认:5)
- **最大范围**:枢轴点之间最大K线数(默认:60)
- **最小范围**:枢轴点之间最小K线数(默认:5)
### 配置设置
#### KSI显示设置
- **显示RSI**:切换RSI指标
- **显示CCI**:切换两条CCI线
- **显示威廉指标 %R**:切换威廉指标(可选)
#### RSI设置
- **RSI长度**:计算周期(默认:22)
- **数据源**:价格源(默认:收盘价)
- **显示背景**:切换绿色/红色背景
- **显示穿越标签**:切换50水平穿越标签
#### RSI背离设置
- **右侧回溯**:枢轴检测右侧
- **左侧回溯**:枢轴检测左侧
- **回溯范围最大值**:最大回溯距离
- **回溯范围最小值**:最小回溯距离
- **显示常规背离**:启用常规背离线
- **显示常规背离标签**:启用常规背离标签
- **显示隐藏背离**:启用隐藏背离线
- **显示隐藏背离标签**:启用隐藏背离标签
#### CCI设置
- **CCI长度**:短期周期(默认:33)
- **CCI中期长度**:中期周期(默认:77)
- **数据源**:价格计算(默认:HLC3)
- **显示CCI(33)**:切换短期CCI
- **显示CCI(77)**:切换中期CCI
#### 威廉指标 %R 设置
- **长度**:计算周期(默认:28)
- **数据源**:价格源(默认:收盘价)
### 使用方法
#### 基础动量交易
1. **仅启用RSI**(主要指标)
- 关注50水平穿越
- 启用穿越标签获取信号
2. **识别动量方向**
- RSI > 50 = 看涨动量
- RSI < 50 = 看跌动量
- 背景颜色确认方向
3. **寻找极值**
- RSI > 80 = 超买(考虑卖出)
- RSI < 20 = 超卖(考虑买入)
4. **交易设置**
- RSI从超卖区向上穿越50时做多
- RSI从超买区向下穿越50时做空
#### 背离交易
1. **启用RSI和背离检测**
- 打开常规背离
- 可选添加隐藏背离
2. **等待背离信号**
- 黄色标签 = 看涨背离
- 蓝色标签 = 看跌背离
3. **用价格结构确认**
- 等待支撑/阻力突破
- 寻找K线形态
- 检查成交量确认
4. **进入仓位**
- 确认后进入
- 止损设在背离枢轴点之外
- 目标下一个关键水平
#### 多振荡器确认
1. **启用全部三个指标**
- RSI(动量)
- CCI双周期(周期分析)
- 威廉指标 %R(极值)
2. **寻找一致性**
- 全部在50以上 = 强劲看涨
- 全部在50以下 = 强劲看跌
- 信号混合 = 盘整
3. **识别极值**
- 所有指标 > 80 = 极度超买
- 所有指标 < 20 = 极度超卖
4. **交易反转**
- 所有指标在极值一致时逆势进入
- 可能的话用背离确认
- 使用紧密止损
#### CCI双周期分析
1. **启用两条CCI线**
- CCI(33) = 短期
- CCI(77) = 中期
2. **观察穿越**
- 绿色线穿越橙色线向上 = 看涨加速
- 绿色线穿越橙色线向下 = 看跌加速
3. **分析周期间背离**
- 短期上升,中期下降 = 潜在反转
- 两者同时上升 = 强趋势
4. **相应交易**
- 跟随穿越方向
- 线条汇合时退出
### 交易策略
#### 策略1:RSI 50水平穿越
**设置:**
- 启用RSI及背景和标签
- 等待明确趋势
- 寻找回调至50水平
**入场:**
- 多头:回调后出现"突破"标签
- 空头:反弹后出现"跌破"标签
**止损:**
- 多头:近期波动低点之下
- 空头:近期波动高点之上
**离场:**
- 出现相反穿越标签
- 或预定目标(2:1风险收益比)
**适合:**趋势跟随、明确市场
#### 策略2:RSI背离反转
**设置:**
- 启用RSI和常规背离
- 等待极端水平(>70或<30)
- 寻找背离信号
**入场:**
- 多头:超卖水平出现黄色"涨"标签
- 空头:超买水平出现蓝色"跌"标签
**确认:**
- 等待价格突破结构
- 检查成交量增加
- 寻找K线反转形态
**止损:**
- 背离枢轴点之外
**离场:**
- 在50水平部分获利
- 其余在相反极值或背离处离场
**适合:**波段交易、震荡市场
#### 策略3:三重振荡器汇合
**设置:**
- 启用全部三个指标
- 等待全部达到极值(>80或<20)
- 寻找一致性
**入场:**
- 多头:三个全部低于20,第一个向上穿越20
- 空头:三个全部高于80,第一个向下穿越80
**确认:**
- 所有指标必须一致
- 价格在支撑/阻力位
- 成交量激增有帮助
**止损:**
- 固定百分比或基于ATR
**离场:**
- 任一指标穿越50水平时
- 或在预定目标
**适合:**高概率反转、波动市场
#### 策略4:CCI双周期系统
**设置:**
- 仅启用两条CCI线
- 禁用RSI和威廉指标以保持清晰
- 观察穿越
**入场:**
- 多头:CCI(33)在50线下方向上穿越CCI(77)
- 空头:CCI(33)在50线上方向下穿越CCI(77)
**确认:**
- 两者都应朝入场方向移动
- 价格突破关键水平有帮助
**止损:**
- CCI反向穿越时
**离场:**
- 两条CCI进入相反极值区域
- 或移动止损
**适合:**捕捉趋势延续、动量交易
#### 策略5:隐藏背离延续
**设置:**
- 启用RSI和隐藏背离
- 确认现有趋势
- 等待回调
**入场:**
- 上升趋势:回调期间出现"隐涨"标签
- 下降趋势:反弹期间出现"隐跌"标签
**确认:**
- 价格守住关键移动平均线
- 趋势结构完整
**止损:**
- 回调极值之外
**离场:**
- 出现常规背离(反转警告)
- 或趋势结构破坏
**适合:**加仓、趋势交易
### 最佳实践
#### 选择显示哪些指标
**新手:**
- 仅使用RSI
- 启用背景颜色和标签
- 关注50水平穿越
- 简单有效
**中级交易者:**
- RSI + 常规背离
- 添加CCI确认
- 使用双重视角
- 更高准确度
**高级交易者:**
- 全部三个指标
- 完整背离检测
- 多时间框架分析
- 信息最大化
#### 振荡器优先级
**主要**:RSI (22)
- 最可靠
- 最佳背离检测
- 适用所有时间框架
- 用作主要决策依据
**次要**:CCI (33/77)
- 添加周期分析
- 确认效果好
- 双周期穿越有价值
- 用于确认RSI信号
**第三**:威廉指标 %R (28)
- 极值读数有用
- 更波动
- 最适合短期
- 谨慎使用以获额外确认
#### 时间框架考虑
**低时间框架(1分钟-15分钟):**
- 更多信号,可靠性较低
- 使用紧密背离参数
- 关注RSI穿越
- 快速进出
**中等时间框架(30分钟-4小时):**
- 信号频率平衡
- 默认设置效果好
- 最适合背离交易
- 波段交易最优
**高时间框架(日线+):**
- 信号较少但更强
- 扩大背离范围
- 所有指标更可靠
- 最适合仓位交易
#### 背离交易技巧
1. **等待确认**
- 仅背离不够
- 需要价格结构突破
- 成交量帮助验证
2. **极值处最佳**
- 80/20水平附近的背离最可靠
- 中间水平背离常失败
- 结合支撑/阻力
3. **多重背离**
- 第二次背离强于第一次
- 第三次背离极其强大
- 注意"三重背离"
4. **时间框架对齐**
- 检查更高时间框架方向
- 顺大趋势方向交易背离
- 逆势背离风险更大
### 指标组合
**与移动平均线配合:**
- 使用EMA(21/55/144)确定趋势
- KSI用于入场时机
- 两者一致时进入
**与成交量配合:**
- 成交量确认突破
- 背离 + 成交量背离 = 更强
- 极值处低成交量 = 可能反转
**与支撑/阻力配合:**
- 价格水平作为目标
- KSI用于入场时机
- 水平处的背离 = 最高概率
**与Bias指标配合:**
- Bias显示价格偏离
- KSI显示动量
- 两者都背离 = 强反转信号
**与OBV指标配合:**
- OBV显示成交量趋势
- KSI显示价格动量
- 成交量/动量背离强大
### 常见形态
1. **看涨反转**:所有振荡器超卖 + RSI看涨背离
2. **看跌反转**:所有振荡器超买 + RSI看跌背离
3. **趋势加速**:RSI > 50,两条CCI上升,威廉指标不极端
4. **趋势减弱**:价格上升时RSI下降(背离前警告)
5. **强趋势**:所有振荡器长时间保持在50上方/下方
6. **盘整**:振荡器频繁穿越50无极值
7. **衰竭**:多个振荡器在极值 + 隐藏背离失败
### 性能提示
- 从简单开始:仅RSI
- 学习时逐渐添加指标
- 禁用未使用功能以保持图表清晰
- 策略性使用标签(不总是开启)
- 为您的市场测试不同RSI长度
- 根据波动性调整背离参数
### 警报条件
指标包含以下警报:
- RSI向上穿越50
- RSI向下穿越50
- RSI常规看涨背离
- RSI常规看跌背离
- RSI隐藏看涨背离
- RSI隐藏看跌背离
---
## Technical Support
For questions or issues, please refer to the TradingView community or contact the indicator creator.
## 技术支持
如有问题,请参考TradingView社区或联系指标创建者。

Victoria Overlay - HTF 200 + VWAP + ATR Stop + MA TrioConsolidated road to minions
Buy Setup:
EMA1 crosses above SMA3.
RSI confirms above 50.
Volume increasing (confirming momentum).
Candle closes above SMA1 base.
Sell Setup:
EMA1 crosses below SMA3.
RSI drops below 50 or exits overbought.
Volume confirms (declining or reversing).
Candle closes below SMA1 base.
Tips:
Think of EMA1 as the scalper’s trigger.
SMA3 is your momentum check.
SMA1 (base) = short-term bias.
Avoid entries during low-volume chop.
Use for day trades or tight scalps; exits happen fast.
Overlay (Smoothed Heikin Ashi + Swing + VWAP + ATR Stop + 200-SMA)
Purpose: Multi-layer trend confirmation + clean structure.
Type: Swing alignment tool.
🟩 BUY / CALL Conditions
Green “Buy (Gated)” arrow appears.
Price is above VWAP, above 200-SMA, and above ATR stop.
ATR stop (green line) sits under price → support confirmed.
Heikin-Ashi candles are green/lime.
Bias label says “Above VWAP | Above 200 | Swing Up”.
🟥 SELL / PUT Conditions
Red “Sell (Gated)” arrow appears.
Price is below VWAP, below 200-SMA, and below ATR stop.
ATR stop (red line) sits above price → resistance confirmed.
Heikin-Ashi candles are red.
Bias label says “Below VWAP | Below 200 | Swing Down”.
Exit / Risk Control:
Close position when price crosses ATR stop.
If Heikin candles flip color, momentum is reversing.
Best Use Cases:
For next-day or multi-hour swing entries.
Use ATR Stop for dynamic stop loss.
Stay out when the bias label is mixed (e.g. “Above VWAP | Below 200 | Swing Down”).
Pro Tip:
On big news days, let VWAP reset post-open before acting on arrows — filters fake signals.
RSI Panel Pro (v6)
Purpose: Strength + exhaustion confirmation.
Type: Momentum filter.
Key Levels:
Overbought: 80+ → take profits soon.
Oversold: 20– → watch for bounce setups.
Bull regime: RSI above 60 = momentum strong.
Bear regime: RSI below 40 = weakness.
Buy / Entry Signals:
RSI crosses up from below 40 or 20.
RSI line is above RSI-EMA (gray line).
Higher timeframe RSI (if used) is also rising.
Trim / Exit:
RSI drops under 60 after being strong.
RSI crosses below its EMA.
Sell / Put Setup:
RSI fails at 60 or drops below 40.
RSI crosses under EMA after a bounce.
Tips:
Pair RSI panel with Victoria Overlay — only take gated buys when RSI confirms.
RSI < 40 but above 20 = “loading zone” for reversals.
RSI > 70 = overextended → wait for confirmation before entering.
Combined Execution Rules
Goal What to Watch Action
Entry (CALL) EMA1 > SMA3, Buy (Gated) arrow, RSI rising > 50 Buy call / open long
Entry (PUT) EMA1 < SMA3, Sell (Gated) arrow, RSI < 50 Buy put / open short
Exit Early Price crosses ATR stop or RSI flips under EMA Exit trade / protect gains
Trend Filter VWAP + 200-SMA alignment Only trade in that direction
Avoid Trades Conflicting bias label or low volume Stay flat
Pro Tips
VWAP → Intraday mean: above = bullish control, below = bearish control.
ATR Stop → Dynamic trailing stop: never widen it manually.
Smoothed Heikin-Ashi → filters noise: trend stays until color flips twice.
RSI Panel → confirms whether to hold through pullbacks.
If RSI and Overlay disagree — wait, not trade.

BMSB Watchlist Alert - Daily w/ 1% Proximity# Bull Market Support Band - Daily Updates with Proximity Alerts
## Overview
This indicator tracks the Bull Market Support Band (20-week SMA and 21-week EMA) with daily resolution updates and proximity warnings. The weekly moving averages update every day on your chart, giving you more frequent signals than traditional weekly-only scripts.
## What It Does
The script monitors price action relative to the BMSB and generates alerts for:
- Price crossing above or below either the 20W SMA or 21W EMA
- Price coming within 1% of either moving average (early warning system)
This proximity feature is useful for catching potential support/resistance tests before they actually happen, giving you advance notice to prepare for entries or exits.
## Key Features
- Weekly MAs that update daily for more responsive monitoring
- Configurable proximity threshold (default 1%, adjustable from 0.1% to 5%)
- Visual proximity zones shown as dotted lines around each MA
- Color-coded background highlighting (green when above both MAs, red when below both, orange when in proximity zone)
- On-chart labels for crosses and proximity warnings
- Status table showing current position relative to the band
## Setup for Watchlist Alerts
1. Add the indicator to any chart
2. Create alerts using these conditions:
- "BMSB Cross Alert" - fires on actual crosses
- "BMSB Proximity Alert" - fires when entering the 1% zone
3. Set interval to 1 day (recommended) or 4 hour for more frequent checks
4. Use "Once Per Bar Close" for the trigger option
5. Apply the same alert to your entire watchlist
## Settings
You can toggle on/off:
- Cross above alerts
- Cross below alerts
- Proximity alerts
- Proximity percentage adjustment
- Visual elements (labels, MA lines, proximity zones)
## Notes
The BMSB is commonly used in crypto markets to identify bull market pullback support levels. This implementation adds the proximity warning system to help you anticipate potential tests of these key levels rather than waiting for confirmed crosses.
Works on any timeframe but designed for daily monitoring of weekly moving averages.

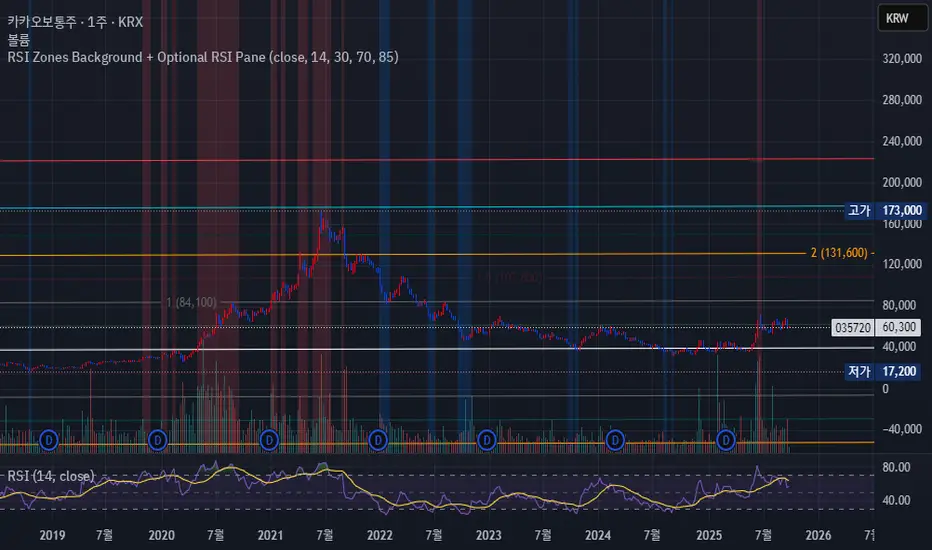
RSI Zones Background + Optional RSI PaneOverview
This Pine Script indicator does two things at once:
Colors the background of the main price chart whenever the RSI value is below a lower threshold (default 30) or above an upper threshold (default 70). This highlights oversold and overbought zones directly on the price chart itself.
Optionally displays a separate RSI panel with the RSI line and shaded region between the two threshold levels for reference.
The indicator is fully customizable through the settings panel—color choices, transparency, and whether to show the separate RSI pane can all be adjusted.
Key Parts of the Code
1. Inputs
src: The source price series for RSI calculation.
len: RSI lookback length (default 14).
lowerThr and upperThr: The lower and upper thresholds (defaults: 30 and 70).
lowColor and highColor: Colors for the background when RSI is below or above the thresholds.
bgTrans: Transparency level for the background shading.
showRSI: Boolean to toggle the optional RSI pane on or off.
2. RSI Calculation
rsi = ta.rsi(src, len)
This computes the RSI from the chosen price source.
3. Background Coloring on the Price Chart
bgCol = rsi <= lowerThr ? color.new(lowColor,bgTrans) :
rsi >= upperThr ? color.new(highColor,bgTrans) :
na
bgcolor(bgCol)
If RSI ≤ lower threshold: background turns lowColor (oversold zone).
If RSI ≥ upper threshold: background turns highColor (overbought zone).
Otherwise, no background color.
4. Optional RSI Pane
plot(showRSI ? rsi : na, display=display.pane)
Plots the RSI line in a separate pane when showRSI is true; otherwise hides it.
5. Horizontal Lines for Thresholds
hLower = hline(lowerThr, ...)
hUpper = hline(upperThr, ...)
Two horizontal lines at the lower and upper thresholds.
Because hline() can’t be wrapped inside if blocks, the script always creates them but makes them transparent (using na color) when the pane is hidden.
6. Filling Between Threshold Lines
fill(hLower, hUpper, color=showRSI ? color.new(color.gray,95) : na)
When the RSI pane is visible, the area between the two threshold lines is shaded in gray to create a “mid-zone” effect. This fill also switches off (becomes na) if the pane is hidden.
7. Alerts
The script also includes two alert conditions:
When RSI crosses below the lower threshold.
When RSI crosses above the upper threshold.
How It Works in Practice
On the price chart, you’ll see the background turn blue (or your chosen color) when RSI is ≤30, and red when RSI is ≥70.
If you enable “Show RSI” in the settings, a separate RSI pane will appear below the price chart, plotting the RSI line with two threshold lines and a shaded region in between.
You can fully adjust transparency and colors to suit your chart style.
Benefits
Quickly visualize overbought and oversold conditions without opening a separate RSI window.
Optional RSI pane provides context when needed.
Customizable colors and transparency make it easy to integrate with any chart theme.
Alerts give you automatic notifications when RSI crosses key levels.
------------------------------------------------------------------------------------------------------------------
개요
이 지표는 두 가지 기능을 동시에 수행합니다.
가격 차트 뒤 배경에 색상 표시
RSI 값이 설정한 하단 임계값(기본 30) 이하이거나 상단 임계값(기본 70) 이상일 때, 가격 차트 뒤쪽에 과매도·과매수 구간을 색으로 표시해줍니다.
선택적으로 RSI 보조창 표시
옵션을 켜면 별도의 RSI 패널이 나타나서 RSI 라인과 두 임계값(30, 70)을 연결한 구간을 음영 처리하여 보여줍니다.
설정 창에서 색상·투명도·보조창 표시 여부를 전부 조정할 수 있습니다.
코드 핵심 설명
1. 입력값
src: RSI 계산에 사용할 가격 소스(기본 종가).
len: RSI 기간(기본 14).
lowerThr / upperThr: RSI 하단·상단 임계값(기본 30, 70).
lowColor / highColor: RSI가 각각 하단 이하·상단 이상일 때 배경 색상.
bgTrans: 배경 투명도(0=불투명, 100=투명).
showRSI: RSI 보조창을 켜고 끌 수 있는 스위치.
2. RSI 계산
rsi = ta.rsi(src, len)
지정한 가격 소스를 기반으로 RSI를 계산합니다.
3. 가격 차트 배경 색칠
bgCol = rsi <= lowerThr ? color.new(lowColor,bgTrans) :
rsi >= upperThr ? color.new(highColor,bgTrans) :
na
bgcolor(bgCol)
RSI ≤ 하단 임계값 → lowColor(과매도 색)
RSI ≥ 상단 임계값 → highColor(과매수 색)
나머지 구간은 색상 없음.
4. 선택적 RSI 보조창
plot(showRSI ? rsi : na, display=display.pane)
showRSI가 켜져 있으면 RSI 라인을 보조창에 표시하고, 꺼져 있으면 숨깁니다.
5. 임계값 가로선
hLower = hline(lowerThr, ...)
hUpper = hline(upperThr, ...)
하단·상단 임계값을 가로선으로 표시합니다.
hline은 if 블록 안에서 쓸 수 없기 때문에 항상 그려지지만, 보조창이 꺼지면 색을 na로 처리해 안 보이게 합니다.
6. 임계값 사이 영역 음영 처리
fill(hLower, hUpper, color=showRSI ? color.new(color.gray,95) : na)
보조창이 켜져 있을 때만 두 가로선 사이를 회색으로 채워 “중립 구간”을 강조합니다.
7. 알림 조건
RSI가 하단 임계값을 아래로 돌파할 때 알림.
RSI가 상단 임계값을 위로 돌파할 때 알림.
실제 작동 모습
가격 차트 뒤쪽에 RSI ≤30이면 파란색, RSI ≥70이면 빨간색 배경이 나타납니다(색상은 설정에서 변경 가능).
RSI 보조창을 켜면, RSI 라인과 임계값 가로선, 그리고 그 사이 음영 영역이 함께 나타납니다.
투명도를 높이거나 낮추어 강조 정도를 조절할 수 있습니다.
장점
별도의 RSI창을 열지 않고도 가격 차트 배경만으로 과매수·과매도 상태를 직관적으로 확인 가능.
필요하면 보조창으로 RSI를 직접 확인하면서 임계값 가이드와 음영 영역을 함께 볼 수 있음.
색상·투명도를 자유롭게 조절할 수 있어 차트 스타일에 맞게 커스터마이징 가능.
RSI가 임계값을 돌파할 때 자동 알림을 받을 수 있음.
$ - HTF Sweeps & PO3HTF Sweeps & PO3 Indicator
The HTF Sweeps & PO3 indicator is a powerful tool designed for traders to visualise higher timeframe (HTF) candles, identify liquidity sweeps, and track key price levels on a lower timeframe (LTF) chart. Built for TradingView using Pine Script v6, it overlays HTF candle data and highlights significant price movements, such as sweeps of previous highs or lows, to help traders identify potential liquidity sweep and reversal points. The indicator is highly customisable, offering a range of visual and alert options to suit various trading strategies.
Features
Higher Timeframe (HTF) Candle Visualisation:
- Displays up to three user-defined HTF candles (e.g., 15m, 1H, 4H) overlaid on the LTF chart.
- Customisable candle appearance with adjustable size (Tiny to Huge), offset, spacing, and colours for bullish/bearish candles and wicks.
- Option to show timeframe labels above or below HTF candles with configurable size and position.
Liquidity Sweep Detection:
- Identifies bullish and bearish sweeps when price moves beyond the high or low of a previous HTF candle and meets specific conditions.
- Displays sweeps on both LTF and HTF with customisable line styles (Solid, Dashed, Dotted), widths, and colours.
- Option to show only the most recent sweep per candle to reduce chart clutter.
Invalidated Sweep Tracking:
- Detects and visualises invalidated sweeps (when price moves past a sweep level in the opposite direction).
- Configurable display for invalidated sweeps on LTF and HTF with distinct line styles and colours.
Previous High/Low Lines:
- Plots horizontal lines at the high and low of the previous HTF candle, extending on both LTF and HTF.
- Customisable line style, width, and color for easy identification of key levels.
- Real-Time Sweep Detection:
-Optional real-time sweep visualisation for active candles, enabling traders to monitor developing price action.
Alert System:
- Triggers alerts for sweep formation (when a new sweep is detected).
- Triggers alerts for sweep invalidation (when a sweep is no longer valid).
- Alerts include details such as timeframe, ticker, and price level for precise notifications.
Performance Optimisation:
- Efficiently manages resources with configurable limits for lines, labels, boxes, and bars (up to 500 each).
- Cleans up outdated visual elements to maintain chart clarity.
Flexible Configuration:
- Supports multiple timeframes for HTF candles with user-defined settings for visibility and number of candles displayed (1–60).
- Toggle visibility for HTF candles, sweeps, invalidated sweeps, and high/low lines independently for LTF and HTF.
This indicator is ideal for traders focusing on liquidity hunting, order block analysis, or price action strategies, providing clear visual cues and alerts to enhance decision-making.

NDOG & NWOG - Liquidity + Sunday Box rroielDescription:
This script combines NDOG & NWOG liquidity levels with a Sunday Box framework to provide traders with structured levels for weekly bias, liquidity mapping, and potential entry/exit zones.
Features:
• Automatic plotting of NDOG & NWOG liquidity zones.
• Sunday Box (weekly open range) drawn to define structure and bias.
• Highlights liquidity sweeps and retests for trade confirmation.
• Configurable settings for box time, liquidity range, and display options.
• Built to support ROI/EL strategies by aligning liquidity with weekly key levels.
Use Case:
Helps traders identify where price is likely to react by combining liquidity-based zones with the Sunday box framework. Designed for clarity, confluence, and efficiency in execution.

FlowStateTrader FlowState Trader - Advanced Time-Filtered Strategy
## Overview
FlowState Trader is a sophisticated algorithmic trading strategy that combines precision entry signals with intelligent time-based filtering and adaptive risk management. Built for traders seeking to achieve their optimal performance state, FlowState identifies high-probability trading opportunities within user-defined time windows while employing dynamic trailing stops and partial position management.
## Core Strategy Philosophy
FlowState Trader operates on the principle that peak trading performance occurs when three elements align: **Focus** (precise entry signals), **Flow** (optimal time windows), and **State** (intelligent position management). This strategy excels at finding reversal opportunities at key support and resistance levels while filtering out suboptimal trading periods to keep traders in their optimal flow state.
## Key Features
### 🎯 Focus Entry System
**Support/Resistance Zone Trading**:
- Dynamic identification of key price levels using configurable lookback periods
- Entry signals triggered when price interacts with these critical zones
- Volume confirmation ensures genuine breakout/reversal momentum
- Trend filter alignment prevents counter-trend disasters
**Entry Conditions**:
- **Long Signals**: Price closes above support buffer, touches support level, with above-average volume
- **Short Signals**: Price closes below resistance buffer, touches resistance level, with above-average volume
- Optional trend filter using EMA or SMA for directional bias confirmation
### ⏰ FlowState Time Filtering System
**Comprehensive Time Controls**:
- **12-Hour Format Trading Windows**: User-friendly AM/PM time selection
- **Multi-Timezone Support**: UTC, EST, PST, CST with automatic conversion
- **Day-of-Week Filtering**: Trade only weekdays, weekends, or both
- **Lunch Hour Avoidance**: Automatically skips low-volume lunch periods (12-1 PM)
- **Visual Time Indicators**: Background coloring shows active/inactive trading periods
**Smart Time Features**:
- Handles overnight trading sessions seamlessly
- Prevents trades during historically poor performance periods
- Customizable trading hours for different market sessions
- Real-time trading window status in dashboard
### 🛡️ Adaptive Risk Management
**Multi-Level Take Profit System**:
- **TP1**: First profit target with optional partial position closure
- **TP2**: Final profit target for remaining position
- **Flexible Scaling**: Choose number of contracts to close at each level
**Dynamic Trailing Stop Technology**:
- **Three Operating Modes**:
- **Conservative**: Earlier activation, tighter trailing (protect profits)
- **Balanced**: Optimal risk/reward balance (recommended)
- **Aggressive**: Later activation, wider trailing (let winners run)
- **ATR-Based Calculations**: Adapts to current market volatility
- **Automatic Activation**: Engages when position reaches profitability threshold
### 📊 Intelligent Position Sizing
**Contract-Based Management**:
- Configurable entry quantity (1-1000 contracts)
- Partial close quantities for profit-taking
- Clear position tracking and P&L monitoring
- Real-time position status updates
### 🎨 Professional Visualization
**Enhanced Chart Elements**:
- **Entry Zone Highlighting**: Clear visual identification of trading opportunities
- **Dynamic Risk/Reward Lines**: Real-time TP and SL levels with price labels
- **Trailing Stop Visualization**: Live tracking of adaptive stop levels
- **Support/Resistance Lines**: Key level identification
- **Time Window Background**: Visual confirmation of active trading periods
**Dual Dashboard System**:
- **Strategy Dashboard**: Real-time position info, settings status, and current levels
- **Performance Scorecard**: Live P&L tracking, win rates, and trade statistics
- **Customizable Sizing**: Small, Medium, or Large display options
### ⚙️ Comprehensive Customization
**Core Strategy Settings**:
- **Lookback Period**: Support/resistance calculation period (5-100 bars)
- **ATR Configuration**: Period and multipliers for stops/targets
- **Reward-to-Risk Ratios**: Customizable profit target calculations
- **Trend Filter Options**: EMA/SMA selection with adjustable periods
**Time Filter Controls**:
- **Trading Hours**: Start/end times in 12-hour format
- **Timezone Selection**: Four major timezone options
- **Day Restrictions**: Weekend-only, weekday-only, or unrestricted
- **Session Management**: Lunch hour avoidance and custom periods
**Risk Management Options**:
- **Trailing Stop Modes**: Conservative/Balanced/Aggressive presets
- **Partial Close Settings**: Enable/disable with custom quantities
- **Alert System**: Comprehensive notifications for all trade events
### 📈 Performance Tracking
**Real-Time Metrics**:
- Net profit/loss calculation
- Win rate percentage
- Profit factor analysis
- Maximum drawdown tracking
- Total trade count and breakdown
- Current position P&L
**Trade Analytics**:
- Winner/loser ratio tracking
- Real-time performance scorecard
- Strategy effectiveness monitoring
- Risk-adjusted return metrics
### 🔔 Alert System
**Comprehensive Notifications**:
- Entry signal alerts with price and quantity
- Take profit level hits (TP1 and TP2)
- Stop loss activations
- Trailing stop engagements
- Position closure notifications
## Strategy Logic Deep Dive
### Entry Signal Generation
The strategy identifies high-probability reversal points by combining multiple confirmation factors:
1. **Price Action**: Looks for price interaction with key support/resistance levels
2. **Volume Confirmation**: Ensures sufficient market interest and liquidity
3. **Trend Alignment**: Optional filter prevents counter-trend positions
4. **Time Validation**: Only trades during user-defined optimal periods
5. **Zone Analysis**: Entry occurs within calculated buffer zones around key levels
### Risk Management Philosophy
FlowState Trader employs a three-tier risk management approach:
1. **Initial Protection**: ATR-based stop losses set at strategy entry
2. **Profit Preservation**: Trailing stops activate once position becomes profitable
3. **Scaled Exit**: Partial profit-taking allows for both security and potential
### Time-Based Edge
The time filtering system recognizes that not all trading hours are equal:
- Avoids low-volume, high-spread periods
- Focuses on optimal liquidity windows
- Prevents trading during news events (lunch hours)
- Allows customization for different market sessions
## Best Practices and Optimization
### Recommended Settings
**For Scalping (1-5 minute charts)**:
- Lookback Period: 10-20
- ATR Period: 14
- Trailing Stop: Conservative mode
- Time Filter: Major session hours only
**For Day Trading (15-60 minute charts)**:
- Lookback Period: 20-30
- ATR Period: 14-21
- Trailing Stop: Balanced mode
- Time Filter: Extended trading hours
**For Swing Trading (4H+ charts)**:
- Lookback Period: 30-50
- ATR Period: 21+
- Trailing Stop: Aggressive mode
- Time Filter: Disabled or very broad
### Market Compatibility
- **Forex**: Excellent for major pairs during active sessions
- **Stocks**: Ideal for liquid stocks during market hours
- **Futures**: Perfect for index and commodity futures
- **Crypto**: Effective on major cryptocurrencies (24/7 capability)
### Risk Considerations
- **Market Conditions**: Performance varies with volatility regimes
- **Timeframe Selection**: Lower timeframes require tighter risk management
- **Position Sizing**: Never risk more than 1-2% of account per trade
- **Backtesting**: Always test on historical data before live implementation
## Educational Value
FlowState serves as an excellent learning tool for:
- Understanding support/resistance trading
- Learning proper time-based filtering
- Mastering trailing stop techniques
- Developing systematic trading approaches
- Risk management best practices
## Disclaimer
This strategy is for educational and informational purposes only. Past performance does not guarantee future results. Trading involves substantial risk of loss and is not suitable for all investors. Users should thoroughly backtest the strategy and understand all risks before live trading. Always use proper position sizing and never risk more than you can afford to lose.
---
*FlowState Trader represents the evolution of systematic trading - combining classical technical analysis with modern risk management and intelligent time filtering to help traders achieve their optimal performance state through systematic, disciplined execution.*

VSA-Stopping VolumeVSA Stopping Volume Indicator
Stopping Volume occurs when candles show decreasing body sizes (narrow spreads) while volume steadily increases.
Example chart:
As you see:
3 consecutive candles in same direction (all green OR all red)
Body sizes (spreads) decreasing progressively: Candle 1 > Candle 2 > Candle 3
Volume increasing progressively: Volume 1 < Volume 2 < Volume 3
This pattern indicates price absorption - increased buying/selling pressure but declining price movement, often signaling exhaustion and potential reversal.
Indicator Features
This indicator detects Stopping Volume candlestick clusters with two signal types:
🔹 BUY/SELL Signals: Generated when pattern occurs at support/resistance zones
🔹 Directional Alerts (▲-green, ▼-red): Generated when pattern occurs outside key levels
Trading Guidelines:
⚠️ Auto-drawn S/R zones are reference only - manual level plotting recommended for accuracy
📊 Best for scalping: M5, M10, M15 timeframes
🛡️ Stop Loss: Place beyond the S/R zone you're trading
🎯 Take Profit: Based on your risk management
Key Concept: Volume expansion + price contraction = potential reversal, especially at SnR levels.
Perfect for scalpers looking to catch reversals at critical zones!

ORB - Opening Range Breakout + AlertsThe only ORB indicator you'll ever need.
- Flexible Range: Tailor the opening range (e.g., 5m, 15m, 30m) to your trading style.
- Key Levels: Auto-plots striking pink/purple support/resistance lines post-range for clear trade setups.
- Breakout Alerts: Reliable LONG/SHORT signals on 5m chart for confirmed breakouts; enable/disable as needed.
- Personalized Design: Customize line color and thickness for optimal visibility.
A friendly reminder that no tool or indicator guarantees success. Integrate this into a robust trading plan.

muraThis indicator is based on moving averages over a certain period using Fibonacci numbers. Pivot points are provided for active trading, which help to trade from the levels.
The indicator takes into account the trend direction, identifies key levels and possible targets.
You can also easily set up notifications for trend changes and receive them in the tradingview app or as an audio signal on your computer. This will help you not to miss anything in the market.
The moving averages with a uniquely recognized trend. 6 moving averages create 3 important trends. The first trend is local from your time frame, the second is global from your time frame and the third trend is predicated for tracking the global trend on an older time frame.
I have identified ways to trade my indicator:
- On a 4-hour time frame you can open trades in one direction with a change in the global trend. That is, if the red trend changes to green, it is time to open longs and vice versa.
- The global trend works best when paired with the local trend. That is, if the global trend is green, we wait until the local trend becomes green and then open longs, as well as in the opposite direction.
- Opening positions when the local trend changes towards the global trend also works well on a 12 hour time frame.
This indicator can be used on any timeframes from 1 minute to 1 year. You can also select levels for trading:
- intraday
- intra-week
- within a month
Note:
- Before you start trading, I strongly recommend you to do your own analysis on your own time frame or pairs
- Recommended for use with additional technical analysis tools

NasyI## NasyI - Multi-Timeframe Technical Analysis Toolkit
### English Description
**NasyI** is a comprehensive technical analysis indicator designed to provide traders with a complete view of market dynamics across multiple timeframes. This indicator combines the power of Exponential Moving Averages (EMAs), Simple Moving Averages (MAs), Volume Weighted Average Price (VWAP), and key support/resistance levels to help traders identify trend direction, potential reversal points, and optimal entry/exit opportunities.
#### Key Features
1. **Multi-Timeframe Analysis System**
- 2-minute EMAs (13, 48) for ultra-short-term trend identification
- 5-minute EMAs (9, 13, 21, 48, 200) for short-term trend confirmation
- Daily EMAs (5, 13, 21, 48, 100, 200) and MAs (20, 50, 100, 200) for longer-term perspective
- Color-coded bands between key EMAs to visually identify trend strength and direction
2. **Advanced VWAP Integration**
- Daily VWAP for intraday support/resistance
- Weekly VWAP for medium-term price reference
- Monthly VWAP for long-term institutional price levels
- All VWAPs properly reset at their respective time period boundaries
3. **Critical Price Level Identification**
- Previous day high/low lines for identifying key breakout and breakdown levels
- Pre-market high/low tracking to identify potential intraday support/resistance zones
- All levels displayed with distinct line styles for easy identification
4. **Dynamic Trend Analysis**
- Color-coded bands between EMAs display trend strength and direction:
- Green bands indicate uptrend conditions (9 EMA > 21 EMA > 48 EMA)
- Red bands indicate downtrend conditions (9 EMA < 21 EMA < 48 EMA)
- Yellow bands indicate neutral/confused market conditions
- Visual representation makes trend changes immediately apparent
5. **Comprehensive Customization Options**
- Fully customizable colors for all indicators and bands
- Adjustable transparency settings for visual clarity
- Optional price labels with customizable placement and appearance
- Ability to show/hide specific components based on trading preferences
#### Trading Applications
This indicator is particularly valuable for:
1. **Day Trading & Scalping**: The 2-minute and 5-minute EMAs with color bands provide clear short-term trend direction and potential reversal signals.
2. **Swing Trading**: Daily EMAs and MAs offer perspective on the larger trend, helping to align short-term trades with the broader market direction.
3. **Gap Trading**: Previous day and pre-market levels help identify potential gap fill scenarios and breakout/breakdown opportunities.
4. **VWAP Trading Strategies**: Multiple timeframe VWAPs allow for identifying institutional participation levels and potential reversal zones.
5. **EMA Cross Systems**: The various EMAs can be used to identify golden crosses and death crosses across multiple timeframes.
#### How the Components Work Together
The power of NasyI comes from the integration of these different technical elements:
1. The short-timeframe EMAs (2m, 5m) provide immediate trend information, while the daily EMAs/MAs provide context about the larger market structure.
2. The color bands between EMAs offer instant visual confirmation of trend alignment or divergence across timeframes.
3. Previous day and pre-market levels add horizontal support/resistance zones to complement the dynamic moving averages.
4. Multiple timeframe VWAPs provide additional confirmation of institutional activity levels and potential reversal points.
By combining these elements, traders can develop a comprehensive market view that integrates price action, trend direction, and key support/resistance levels all in one indicator.
#### Usage Instructions
1. Apply the NasyI indicator to your chart (works best on intraday timeframes from 1-minute to 30-minute).
2. Observe the relationship between price and the various EMAs:
- Price above the 2m/5m EMAs with green bands indicates bullish short-term conditions
- Price below the 2m/5m EMAs with red bands indicates bearish short-term conditions
3. Use the daily EMAs/MAs and VWAPs as targets for potential price movements and reversal zones.
4. Previous day and pre-market high/low lines provide key levels to watch for breakouts or breakdowns.
5. Customize the appearance according to your preferences using the extensive settings options.
This indicator represents a unique approach to technical analysis by combining multiple timeframe perspectives into a single, visually intuitive display that helps traders make more informed decisions based on a comprehensive view of market conditions.
### 中文描述
**NasyI** 是一个全面的技术分析指标,旨在为交易者提供跨多个时间周期的完整市场动态视图。该指标结合了指数移动平均线(EMA)、简单移动平均线(MA)、成交量加权平均价格(VWAP)和关键支撑/阻力水平的力量,帮助交易者识别趋势方向、潜在反转点和最佳进出场机会。
#### 主要特点
1. **多时间周期分析系统**
- 2分钟EMAs(13,48)用于超短期趋势识别
- 5分钟EMAs(9,13,21,48,200)用于短期趋势确认
- 日线EMAs(5,13,21,48,100,200)和MAs(20,50,100,200)用于更长期的视角
- 关键EMAs之间的彩色带状区域直观显示趋势强度和方向
2. **高级VWAP整合**
- 日内VWAP作为日内支撑/阻力
- 周内VWAP作为中期价格参考
- 月内VWAP作为长期机构价格水平
- 所有VWAP在各自的时间周期边界正确重置
3. **关键价格水平识别**
- 前一交易日高点/低点线用于识别关键突破和跌破水平
- 盘前高点/低点跟踪用于识别潜在的日内支撑/阻力区域
- 所有水平以不同的线条样式显示,便于识别
4. **动态趋势分析**
- EMAs之间的彩色带状区域显示趋势强度和方向:
- 绿色带状区域表示上升趋势(9 EMA > 21 EMA > 48 EMA)
- 红色带状区域表示下降趋势(9 EMA < 21 EMA < 48 EMA)
- 黄色带状区域表示中性/混乱市场条件
- 视觉表示使趋势变化立即显现
5. **全面的自定义选项**
- 所有指标和带状区域的颜色完全可定制
- 可调节的透明度设置,提高视觉清晰度
- 可选的价格标签,带有可定制的位置和外观
- 能够根据交易偏好显示/隐藏特定组件
#### 交易应用
此指标对以下方面特别有价值:
1. **日内交易和短线交易**:2分钟和5分钟EMAs与色带提供清晰的短期趋势方向和潜在反转信号。
2. **摇摆交易**:日线EMAs和MAs提供对更大趋势的视角,帮助将短期交易与更广泛的市场方向对齐。
3. **缺口交易**:前一日和盘前水平帮助识别潜在的缺口填充情况和突破/跌破机会。
4. **VWAP交易策略**:多时间周期VWAP允许识别机构参与水平和潜在反转区域。
5. **EMA交叉系统**:各种EMAs可用于识别跨多个时间周期的黄金交叉和死亡交叉。
#### 组件如何协同工作
NasyI的强大之处在于这些不同技术元素的集成:
1. 短时间周期EMAs(2m,5m)提供即时趋势信息,而日线EMAs/MAs提供关于更大市场结构的背景。
2. EMAs之间的色带提供趋势对齐或跨时间周期分歧的即时视觉确认。
3. 前一日和盘前水平添加水平支撑/阻力区域,补充动态移动平均线。
4. 多时间周期VWAP提供机构活动水平和潜在反转点的额外确认。
通过结合这些元素,交易者可以发展出全面的市场视图,整合价格行动、趋势方向和关键支撑/阻力水平于一个指标中。
#### 使用说明
1. 将NasyI指标应用到您的图表上(最适合1分钟至30分钟的日内时间周期)。
2. 观察价格与各种EMAs之间的关系:
- 价格位于2m/5m EMAs之上,带有绿色带状区域,表示看涨的短期条件
- 价格位于2m/5m EMAs之下,带有红色带状区域,表示看跌的短期条件
3. 使用日线EMAs/MAs和VWAPs作为潜在价格移动和反转区域的目标。
4. 前一日和盘前高点/低点线提供需要关注的突破或跌破的关键水平。
5. 使用广泛的设置选项根据您的偏好自定义外观。
这个指标代表了一种独特的技术分析方法,将多个时间周期的视角结合到一个单一的、视觉直观的显示中,帮助交易者基于对市场条件的全面视图做出更明智的决策。

EMA with Bar Count
---
### **Key Features and Functionalities**
#### 1. **Multi-Timeframe Exponential Moving Averages (EMA)**
- The script calculates and plots EMAs for various timeframes (e.g., 1 minute, 5 minutes, 60 minutes, daily, and custom intervals).
- Users can customize the length and resolution of each EMA using inputs.
- Different colors are assigned to each EMA for easy identification on the chart.
#### 2. **Background Coloring**
- Optional background coloring (`bgcolor`) indicates whether the current price is above or below the 1-hour 20 EMA.
- Green indicates the price is above, and red indicates the price is below the EMA.
#### 3. **Bar Count Labeling**
- The script tracks bar counts and displays labels at specific intervals (e.g., every 3 bars).
- Label size and text color can be customized through user inputs.
#### 4. **Inside and Outside Bar Detection**
- Detects and highlights "Inside Bars" and "Outside Bars" on the chart.
- **Inside Bar**: The current bar's high and low are within the previous bar's range.
- **Outside Bar**: The current bar's range exceeds the previous bar's range.
- These patterns are marked with shapes for visual identification.
#### 5. **Bullish/Bearish Candle Streaks**
- Identifies and marks streaks of three consecutive bullish or bearish candles.
- **Bullish Streaks**: Marked with green shapes above the bar.
- **Bearish Streaks**: Marked with red shapes above the bar.
#### 6. **Time-Based Marking**
- The script includes an option to highlight specific time intervals (e.g., 7:30 AM) with a colored vertical line or background shading.
- Configurable time inputs allow flexibility.
#### 7. **Micro Gap Detection**
- Highlights gaps between the opening price of the current bar and the closing price of the previous bar.
- Blue shapes indicate bullish gaps.
- Purple shapes indicate bearish gaps.
#### 8. **TR (Trading Range) Detection**
- Identifies bars with significant overlap based on a user-defined threshold.
- Displays "TR" labels when overlap conditions are met.
#### 9. **Bar Coloring**
- Optionally colors bars based on specific conditions:
- Green: Bullish breakout (high and low higher than the previous bar, closing above the midpoint).
- Red: Bearish breakout (high and low lower than the previous bar, closing below the midpoint).
#### 10. **50% Midpoint Line**
- Displays a horizontal line at the 50% midpoint of the bar's range, customizable for the current or last bar only.
#### 11. **Pattern Detection**
- Recognizes specific candlestick patterns (e.g., IOI, OII, IOO).
- Provides alerts for detected patterns or predefined thresholds.
#### 12. **Alerts**
- Configurable alerts for:
- Specific patterns (e.g., IOI, OII, IOO).
- Bar range exceeding a user-defined threshold.
- Bullish or bearish streaks.
#### 13. **Gap Detector**
- Identifies gaps between bars and marks them with shaded boxes.
- Bullish gaps are shaded green, while bearish gaps are shaded red.
#### 14. **Advanced Customization**
- Extensive user inputs allow traders to tailor the indicator to their trading style.
- Includes support for various levels of detail (e.g., debug mode, label visibility, etc.).
#### 15. **ZigZag and Wedge Patterns**
- Optional zigzag lines to connect swing highs and lows.
- Detects wedge patterns using customizable settings for pivot points and angle differences.
---
### **Use Case Scenarios**
1. **Trend Identification**: Use multi-timeframe EMAs to confirm overall market direction.
2. **Range Trading**: Trade within ranges using detected inside and outside bars as key levels.
3. **Breakout Trading**: Use patterns like IOI and OII to anticipate breakouts.
4. **Scalping**: Exploit bullish and bearish streaks or micro gaps for quick trades.
5. **Pattern-Based Alerts**: Set up alerts for specific market conditions or candlestick patterns.
### **Why This Indicator Is Useful**
- Combines multiple trading tools into a single, customizable script.
- Saves time by automating complex calculations and pattern detections.
- Improves decision-making with clear visual cues and configurable alerts.
Let me know if you'd like any additional explanations or adjustments!

Levels Strength Index [BigBeluga]Levels Strength Index provides a unique perspective on market strength by comparing price positions relative to predefined levels, delivering a dynamic probability-based outlook for potential up and down moves.
🔵 Idea:
The Levels Strength Index analyzes the price position against a series of calculated levels, assigning probabilities for upward and downward movements. These probabilities are displayed in percentage form, providing actionable insights into market momentum and strength. The color-coded display visually reinforces whether the price is predominantly above or below key levels, simplifying trend analysis.
🔵 Key Features:
Dynamic Probability Calculation: The indicator compares the current price position relative to 10 predefined levels, assigning an "Up" and "Down" percentage. For example, if the price is above 8 levels, it will display 80% upward and 20% downward probabilities.
Color-Coded Trend Visualization: When the price is above the majority of levels, the display turns green, signaling strength. Conversely, when below, it shifts to orange, reflecting bearish momentum.
Clear Up/Down Probability Labels: Probabilities are displayed with directional arrows next to the price, instantly showing the likelihood of upward or downward moves.
Probability-Based Price Line: The price line is color-coded based on the probability percentages, allowing a quick glance at the prevailing trend and market strength. This can be toggled in the settings.
Customizable Transparency: Adjust the transparency of the levels to seamlessly integrate the indicator with your preferred chart setup.
Fully Configurable: Control key parameters such as the length of levels and price color mode (trend, neutral, or none) through intuitive settings.
🔵 When to Use:
The Levels Strength Index is ideal for traders looking to:
Identify strong upward or downward market momentum using quantified probabilities.
Visualize price strength relative to key levels with intuitive color coding.
Supplement existing level-based strategies by combining probabilities and market positioning.
Gain instant clarity on potential market moves with percentage-based insights.
Whether you're trading trends or ranges, this tool enhances decision-making by combining level-based analysis with a dynamic probability system, offering a clear, actionable perspective on market behavior.
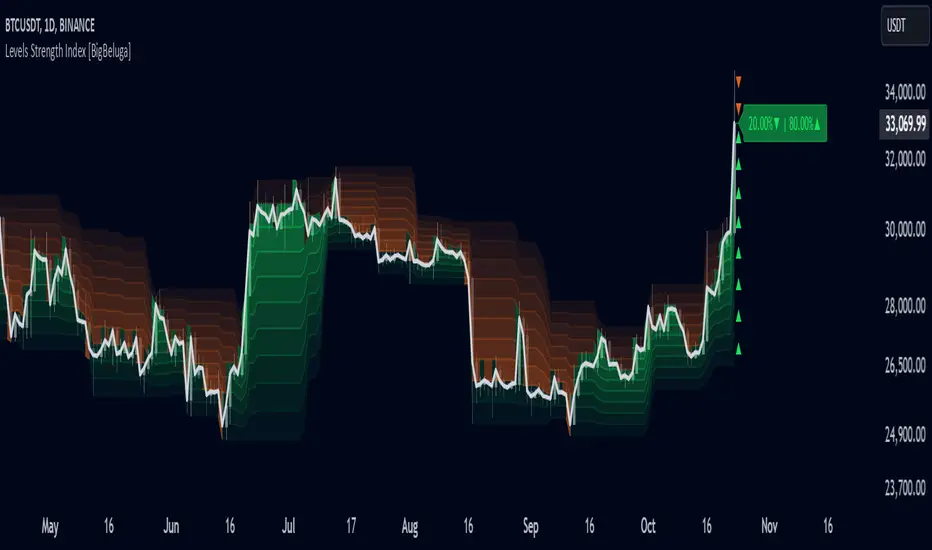
Key Zone LocatorThe "Key Locator" indicator identifies important price levels on a chart by analyzing historical data. It does this by:
Counting Touches: It calculates how many times the price touches each level within a specified period. This helps identify levels that the market frequently interacts with, which can indicate significant support or resistance.
Measuring Volume: It also sums up the trading volume at each level during the same period. High volume at a particular level can suggest strong interest or activity, making that level more significant.s based on historical market activity.
By combining these two metrics—touches and volume—the indicator highlights the most important price level on the chart, helping traders make informed decisions based on where the market has shown significant activity in the past.
Level Calculation:
The indicator first identifies the highest and lowest prices over a specified period, which is determined by the length parameter. It then divides this price range into 200 equal segments, creating potential key levels across the chart. Each segment represents a level where the price might show significant activity.
Metric Calculation:
For each of these levels, the indicator calculates two key metrics. First, it counts how many times the price touches or crosses each level during the specified period. Second, it sums up the trading volume associated with these touches at each level. This dual analysis helps in identifying levels that are not only frequently interacted with but also have substantial trading activity.
Normalization:
To facilitate comparison between different levels, the indicator normalizes both the touch count and the volume for each level to a scale from 0 to 10. This involves dividing each metric by its maximum observed value in the period and scaling it accordingly, ensuring that both metrics are on a comparable scale.
Scoring and Balancing:
Each level is assigned a score based on a weighted average of its normalized touch and volume scores. The weight_balance parameter allows users to adjust the emphasis between touches and volume. A higher weight on touches will prioritize levels frequently interacted with, while more emphasis on volume will highlight levels with significant trading activity.
Identify Key Level:
Finally, the indicator identifies the level with the highest combined score as the most significant. This key level is plotted on the chart in red, providing traders with a visual indication of potential areas of support or resistance based on historical data.
This comprehensive approach allows traders to pinpoint where crucial market activity has occurred, aiding them in making strategic decisions based on historical price behavior and trading volumes.
Please note that while the "Key Locator" indicator provides valuable insights based on historical data, it does not guarantee future performance or outcomes. Trading involves risks, and it's important to use this tool in conjunction with other analysis methods and risk management strategies. Always consider your financial situation and consult with a financial advisor if necessary before making trading decisions.

Advanced Volume-Driven Breakout SignalsThe "Advanced Volume-Driven Breakout Signals" indicator is a cutting-edge tool designed to help traders identify high-potential trading opportunities through sophisticated volume analysis techniques. This indicator integrates volume flow analysis, moving averages, and Relative Volume (RVOL) to provide a comprehensive view of market conditions, going beyond traditional Volume Spread Analysis (VSA) methods.
Key Features:
Volume Flow Analysis: Distinguishes bullish and bearish volume flows with distinct colors, making it easier to visualize market sentiment and potential breakout points.
Volume Flow Moving Averages: Calculates moving averages for volume using various methods (SMA, EMA, WMA, HMA, VWMA), accommodating different trading strategies. This includes settings for adjusting the type of moving average and its period, as well as thresholds for high, medium, and low volume levels.
Volume Spikes Detection: Identifies significant volume spikes based on user-defined multipliers and moving averages, highlighting unusual trading activity.
Volume MA Cloud Settings: Computes general moving averages of volume to track trends and detect deviations. This feature includes options to select different moving average types and adjust thresholds for detecting high volume activity.
Relative Volume (RVOL): Measures current volume relative to historical averages, triggering signals when RVOL exceeds predefined thresholds, indicating notable changes in trading activity.
Entry Conditions: Provides clear long and short entry signals based on combined volume flow conditions and RVOL, offering actionable trading opportunities.
Volume Visualization:
— Bullish Volume Flow: Light and dark green bars indicate bullish volume flow.
— Bearish Volume Flow: Light and dark red bars denote bearish volume flow.
— High Volume Bars: Highlighted in yellow, and extreme volume bars in orange for additional context. These bars are plotted for visual aid and do not directly influence trade signals, focusing instead on the quality and strength of the volume flow.
Alerts: Allows users to create alert notifications for long and short entry signals when the criteria are met, enabling traders to respond promptly to trading opportunities.
Usage:
Overlay: Apply the indicator directly to your price chart to visualise real-time signals and volume conditions.
Customisable: Adjust settings for moving averages, RVOL, and other parameters to match your trading strategy and preferences.
Comparison to VSA Scripts: The "Advanced Volume-Driven Breakout Signals" indicator extends beyond traditional VSA scripts by incorporating a wider range of analytical features. While VSA primarily focuses on volume spread patterns and price action, this indicator offers enhanced functionality with advanced RVOL metrics, customizable moving averages, and detailed volume spike detection, making it a more versatile tool for identifying breakout opportunities and managing trades. It is particularly effective when used alongside key levels and order blocks.
Acknowledgements: Special thanks to @oh92 and @goofoffgoose for their invaluable scripts, which served as inspiration in the development of this advanced trading indicator.
Notes: The script is continually evolving, with ongoing refinements aimed at enhancing accuracy and performance.

Previous and Premarket High/Low IndicatorDescription:
The "Previous and Premarket High/Low" indicator is designed to help traders identify key levels during the premarket, postmarket, and regular trading sessions. It highlights the highest and lowest prices during the premarket session and the previous trading day, providing critical levels for intraday trading strategies.
Features:
Customizable Display Settings: Users can adjust the colors, line styles, and line widths for the premarket and previous day high/low levels.
Session Labels: Clear labels indicating premarket and postmarket sessions for easy identification.
Alerts: Set alerts for significant price movements, such as new highs or lows during premarket and previous trading sessions.

EMA MTF PlusI like trading the 1 minute and 3 minutes time-frames. I'm what is commonly called a "scalper". Long term investments yes, I have some, but for trading, I don't have neither the time,
nor the patience to wait hours or days for my trade to be complete.
This doesn't mean I discount the higher time-frames, no, I actually rely heavily on them. I found that EMAs do a decent job as support/resistance, sometimes to a tick level of precision. And this is important for a 1 minute trader.
As such, I made this script that tracks the higher time-frames EMAs and displays the last value as a line.
I do not need the whole EMA, I'm not interested in crossovers or crossunders, these are anyway late signals for me.
What's with the triangles? These are local tops/bottoms , candles that have a have decent size of the wick. These tops and bottoms are by no means "final", they are merely a rejection at certain levels of price. Due to markets complexities (and human erratic behaviors hehe) these levels could be breached at the very next candle. For a more "final" version (nothing is really final but..) I added Schaff Trend Cycle as filter, so a triangle will pop only when a trend is mature enough ( STC with a value near 0 or near 100).
Colored bars. When the body of the candle is big, it shows strength. Strong bars tend to have follow through, especially when breaking key levels. The script looks at the body of the candle and compares it with ATR (Average True Range), if it's at least 0.8 of ATR it changes the bar color to yellow (bull candles) or fuchsia(bear candles).
Range identifier. This code is copied from Lazy Bear (if there are any issues please let me know), it's very useful in conjunction with colored bars.
I look for breakout candles that go outside of the range as a signal for a trade.
There are many ways in which this script can be useful, like trading mean reversions or momentum trades (breakouts) or simply trend following trades.
I hope you guys find it useful, you can play with default values and change them as you like, these are what I found to be working best for me and my trading universe (mostly crypto).
Special thanks for the original work of:
LazyBear
everget
Jim8080

Chart Wolf WLR Toolkit (VWAP + PDH/PDL + Kill Zone)Overview
This indicator is a single, unified trading framework that combines context → levels → confirmation → execution into one workflow. It is not a “mashup” of unrelated indicators — each component feeds the next step of the decision process so you can make the same type of decision every day with less chart clutter.
What makes it original
Most indicators independently display signals (trend, sessions, levels, etc.). This script is original in that it links components into a structured sequence:
Context (where and when): identifies market session/time context and key reference zones.
Key Levels (what matters): plots specific levels that price reacts to (e.g., previous day levels, value area levels, VWAP / anchors, etc.).
Confirmation (why now): requires price behavior to confirm acceptance/rejection around those levels instead of firing signals randomly.
Execution (how to trade it): provides clear entry/exit visualization and risk reference points once confirmation conditions are met.
How it works (conceptual logic)
The script follows a simple cause-and-effect model:
Reference levels define “decision areas” (places where liquidity and reactions commonly happen).
Price interacting with a decision area triggers state tracking (e.g., approaching level → testing level → rejection/acceptance).
A signal only appears when a complete sequence occurs (example: sweep/test → rejection/acceptance confirmation → continuation cue).
Optional filters (session, volatility, trend bias, etc.) reduce low-quality signals by requiring trades to occur in the intended conditions.
How to use it (step-by-step)
Choose your market & timeframe
Recommended: use a higher timeframe for context, lower timeframe for entries.
Example workflow: 15m for context + 5m/1m for execution.
Mark the decision areas
Use the plotted levels as “zones of interest.”
Your job is to wait for price to interact with these zones.
Wait for confirmation
Only take signals that occur at or near decision areas.
If price is chopping in the middle (between key levels), avoid trading.
Execute with defined risk
Stops should be placed beyond the rejection/sweep point or beyond the decision zone (depending on your strategy).
Targets can be the next major level plotted by the script.
Settings (what to adjust)
Session filter: turn on if you only trade specific hours (e.g., NY open).
Level visibility: hide levels you don’t use to reduce clutter.
Signal strictness: increase strictness to reduce frequency and improve quality; decrease for more signals.
Alerts: enable alerts for confirmed signals only (recommended).
Best practices
This tool performs best when you treat signals as confirmation, not “auto-trades.”
Always prioritize trades that occur at major levels during high-liquidity hours.
Backtest your market/timeframe combo before using it live.
Notes / limitations
Like all indicators, it does not predict the future; it organizes decision-making around recurring market behaviors.
Signals can appear during news volatility; consider disabling trading during major scheduled events.

Alpha Options System# Apex Options Sniper - Advanced Multi-Signal Day Trading System
## 🎯 Overview
**Apex Options Sniper** is a professional-grade, multi-signal trading indicator specifically engineered for high-probability day trading of weekly options. This comprehensive system combines 10+ technical indicators into a sophisticated scoring algorithm that identifies optimal entry points with institutional-level precision.
Perfect for traders of SPY, QQQ, and high-volume stocks, this indicator eliminates guesswork by providing clear BUY CALLS and BUY PUTS signals based on multiple technical confluences.
---
## 🚀 Key Features
### **Multi-Signal Confluence Engine**
- **10+ Technical Indicators** working in harmony
- **Weighted Scoring System** (0-30+ points) for signal strength
- **Real-time Signal Classification**: Strong vs Moderate signals
- **False Signal Reduction** through multi-confirmation requirements
### **Advanced Momentum Analysis**
- ✅ RSI with Divergence Detection (bullish & bearish)
- ✅ Stochastic Oscillator (oversold/overbought + crossovers)
- ✅ MACD with crossover and momentum confirmation
- ✅ Automatic divergence spotting for reversal trades
### **Sophisticated Trend Detection**
- ✅ Triple EMA System (9/21/50) with alignment scoring
- ✅ SuperTrend Indicator with trend flip alerts
- ✅ VWAP for institutional price levels
- ✅ Multi-timeframe trend confirmation
### **Professional Volume Analysis**
- ✅ Volume Spike Detection (vs 20-period average)
- ✅ OBV (On-Balance Volume) with divergence detection
- ✅ Order Flow Analysis (buy vs sell pressure)
- ✅ Relative volume ratio display
### **Advanced Pattern Recognition**
- ✅ Bollinger Band Squeeze detection (volatility expansion)
- ✅ BB breakout signals (major move initiation)
- ✅ Automatic Support & Resistance levels (pivot-based)
- ✅ Price reaction scoring at key levels
### **Built-in Risk Management**
- ✅ ATR-based Stop Loss calculations
- ✅ Customizable Risk:Reward ratios
- ✅ Position sizing recommendations
- ✅ Real-time profit target calculations
### **Comprehensive Visual Dashboard**
- ✅ Live scoring breakdown for all indicators
- ✅ Individual signal strength display
- ✅ Bull vs Bear score comparison
- ✅ Color-coded signal status
- ✅ Risk management metrics
---
## 📊 How It Works
### **Scoring System**
The indicator assigns points based on technical conditions:
| **Category** | **Max Points** | **Conditions** |
|-------------|---------------|----------------|
| Momentum (RSI/Stoch) | 8 | Oversold/overbought + divergences |
| MACD | 4 | Crossovers + momentum direction |
| Trend (EMAs) | 6 | EMA alignment + SuperTrend |
| Volume | 4 | Spikes + OBV divergences |
| Order Flow | 2 | Buy/sell pressure imbalance |
| Bollinger Bands | 2 | Squeeze + breakouts |
| Support/Resistance | 2 | Price at key levels |
| VWAP | 1 | Above/below institutional level |
### **Signal Thresholds**
- **🚀 STRONG CALLS**: Bull score ≥6, Net score ≥4
- **📈 CALLS**: Bull score ≥4, Net score ≥2
- **🔥 STRONG PUTS**: Bear score ≥6, Net score ≤-4
- **📉 PUTS**: Bear score ≥4, Net score ≤-2
### **Multi-Timeframe Filter**
Optional higher timeframe confirmation reduces false signals by ensuring the broader trend supports your trade direction.
---
## 🎮 How to Use
### **Installation**
1. Open TradingView Pine Editor
2. Paste the complete indicator code
3. Click "Add to Chart"
4. Customize settings to your preference
### **Recommended Settings**
**For SPY/QQQ Day Trading:**
- Timeframe: 1-minute or 5-minute
- Strong Signal Threshold: 6
- Moderate Signal Threshold: 4
- Multi-timeframe Confluence: ON
**For Individual Stocks:**
- Timeframe: 5-minute or 15-minute
- Increase SuperTrend multiplier to 3.5-4.0
- Enable all advanced features
**For Scalping:**
- Timeframe: 1-minute
- Use STRONG signals only (6+)
- Tight stop loss (1.0-1.5 ATR multiplier)
### **Best Trading Times**
- **9:30-11:00 AM EST** - Highest volume, strongest signals
- **2:00-4:00 PM EST** - Afternoon momentum plays
- Avoid 11:30 AM-1:30 PM EST (lunch chop)
---
## 📈 Signal Interpretation
### **What You'll See on Chart:**
**Visual Signals:**
- 🟢 **Green Triangle (CALLS)**: Bullish entry point
- 🟢 **Large Green Triangle (STRONG CALLS)**: High-confidence bullish entry
- 🔴 **Red Triangle (PUTS)**: Bearish entry point
- 🔴 **Large Red Triangle (STRONG PUTS)**: High-confidence bearish entry
- 💎 **Small Diamonds**: RSI/OBV divergences (reversal warning)
**Dashboard Information:**
- Individual indicator values and signals
- Real-time score breakdown
- Bull/Bear score totals
- ATR stop loss levels
### **Entry Rules:**
✅ **High Probability Trades (Take These):**
- Strong signal (6+ score)
- 3+ indicators confirming
- Volume spike present
- SuperTrend aligned
- Higher timeframe confirms
⚠️ **Moderate Trades (Smaller Position):**
- Moderate signal (4-5 score)
- 2+ indicators confirming
- Normal volume
- Mixed trend signals
❌ **Avoid These:**
- Conflicting signals (Bull score ≈ Bear score)
- Low volume
- During major news events
- Bollinger squeeze without breakout direction
---
## 🛡️ Risk Management Guide
### **Position Sizing:**
- **Strong Signals (6+)**: 3-5% of portfolio
- **Moderate Signals (4-5)**: 2-3% of portfolio
- **Low Conviction**: 1-2% or skip
### **Stop Loss Strategy:**
- Use ATR-based stops (displayed in dashboard)
- Default: 1.5x ATR from entry
- Weekly options: 30-50% premium loss maximum
- Never hold through stop loss hoping for recovery
### **Profit Targets:**
- **Quick Scalps**: 25-50% gain (15-30 min)
- **Day Trades**: 50-100% gain (same day exit)
- **Swing**: 100-200% gain (1-2 days max for weeklies)
- **Take partial profits** at first target, let rest run
### **Time Decay Management (Weekly Options):**
- Monday-Wednesday: Hold overnight acceptable on strong signals
- Thursday: Close by EOD unless very strong conviction
- Friday: Avoid holding overnight, theta decay accelerates
---
## 🔔 Alert Configuration
### **Recommended Alerts:**
**Essential Alerts:**
1. 🚀 Strong Buy Calls
2. 🔥 Strong Buy Puts
**Advanced Alerts:**
3. 💎 RSI Bullish Divergence
4. ⚠️ RSI Bearish Divergence
5. 🔶 Bollinger Band Squeeze
6. ✅ SuperTrend Bull Flip
7. ❌ SuperTrend Bear Flip
**Alert Setup:**
- Set frequency: "Once Per Bar Close"
- Enable for all devices
- Use webhook for automation (optional)
---
## 💡 Pro Trading Tips
### **Maximize Win Rate:**
1. **Wait for confluence** - Best trades have 3+ indicators aligned
2. **Respect the dashboard** - Check WHY it's signaling (which indicators)
3. **Volume is king** - Signals with volume spikes are significantly more reliable
4. **Use BB Squeeze** - When squeeze + signal = explosive directional move
5. **SuperTrend flips** - Major trend change confirmations, very powerful
6. **Watch for divergences** - Diamond markers = hidden reversal opportunities
### **Common Mistakes to Avoid:**
❌ Trading every signal (be selective)
❌ Ignoring volume (volume confirms everything)
❌ Fighting the higher timeframe trend
❌ Oversizing positions on moderate signals
❌ Holding weekly options too long (theta decay)
❌ Trading during lunch hour (11:30-1:30 EST)
### **Advanced Techniques:**
- **Divergence + Support/Resistance** = Highest probability reversals
- **BB Squeeze + EMA alignment** = Explosive trend continuations
- **SuperTrend flip + Volume spike** = Major trend change entries
- **Multiple timeframe analysis** - Check 5m signal on 1m chart for precision entries
---
## 📊 Indicator Components Explained
### **RSI (Relative Strength Index)**
- Measures momentum and overbought/oversold conditions
- Divergences signal potential reversals before they happen
- Score: 2-3 points for extremes and divergences
### **Stochastic Oscillator**
- Confirms momentum extremes
- Crossovers provide entry timing
- Score: 1-2 points
### **MACD (Moving Average Convergence Divergence)**
- Trend following momentum indicator
- Crossovers signal momentum shifts
- Score: 1-3 points based on signal strength
### **EMA System (9/21/50)**
- Dynamic support and resistance
- Alignment shows trend strength
- Price position relative to EMAs scores 1-2 points
### **SuperTrend**
- Volatility-based trend indicator
- Reduces whipsaws in choppy conditions
- Trend flips are major signals (2 points)
### **Bollinger Bands**
- Volatility measurement
- Squeeze = calm before the storm
- Breakouts = directional move initiation (2 points)
### **Volume Analysis**
- Confirms price movement legitimacy
- Spikes validate signals (2 points)
- OBV divergences predict reversals (2 points)
### **Order Flow**
- Buy vs sell pressure measurement
- Institutional footprint detection
- Score: 2 points for strong imbalances
---
## 🎓 Learning Path
### **Beginner (Week 1-2):**
- Use STRONG signals only
- Focus on high-volume stocks (SPY/QQQ)
- Trade only first hour of market
- Use paper trading first
### **Intermediate (Week 3-4):**
- Add moderate signals to your arsenal
- Learn to read the dashboard
- Understand why each signal triggers
- Start combining with support/resistance
### **Advanced (Month 2+):**
- Use divergence signals
- Trade BB squeeze breakouts
- Optimize settings for your style
- Develop your own confluence rules
---
## ⚙️ Customization Guide
### **Adjustable Parameters:**
**Momentum Settings:**
- RSI Length (default: 14)
- RSI Oversold/Overbought levels (30/70)
- Stochastic Length (14)
**Trend Settings:**
- EMA periods (9/21/50)
- SuperTrend ATR Length (10)
- SuperTrend Multiplier (3.0)
**Volume Settings:**
- Volume MA Length (20)
- Volume Spike Threshold (1.5x)
**Advanced Settings:**
- Bollinger Band Length (20)
- BB Standard Deviation (2.0)
- Pivot Lookback (10)
**Signal Thresholds:**
- Strong Signal Score (default: 6)
- Moderate Signal Score (default: 4)
**Risk Management:**
- ATR Length (14)
- Stop Loss Multiplier (1.5)
- Risk:Reward Ratio (2.0)
---
## 📈 Performance Optimization
### **For Volatile Markets (VIX > 25):**
- Increase SuperTrend multiplier to 4.0
- Raise signal thresholds (+1 point)
- Tighten stop losses (1.0-1.2 ATR)
### **For Ranging Markets:**
- Focus on RSI extremes and divergences
- Use BB squeeze signals
- Ignore moderate signals
- Wait for support/resistance confirmation
### **For Trending Markets:**
- Follow SuperTrend direction religiously
- Use EMA alignment signals
- Allow wider stops (2.0 ATR)
- Take partial profits, let winners run
---
## 🔍 Troubleshooting
**Too Many Signals:**
- Increase signal thresholds to 7/5
- Enable multi-timeframe filter
- Trade only STRONG signals
**Missing Signals:**
- Decrease thresholds to 5/3
- Disable multi-timeframe filter
- Check that all features are enabled
**Whipsaw in Choppy Markets:**
- Increase SuperTrend multiplier
- Require volume spike confirmation
- Avoid trading 11:30 AM-1:30 PM EST
---
## 🏆 Best Practices
✅ **Always check:**
1. Dashboard shows why signal triggered
2. Volume confirms the move
3. Not during news events
4. Adequate time until expiration
✅ **Risk Management:**
1. Never risk more than 2% per trade
2. Use stops religiously
3. Take profits at targets
4. Don't revenge trade
✅ **Journal Your Trades:**
1. Entry price and signal strength
2. Which indicators triggered
3. Exit price and profit/loss
4. What worked and what didn't
---
## 📞 Support & Updates
This indicator is designed to evolve with market conditions. Recommended to:
- Review settings monthly
- Backtest on your favorite instruments
- Adjust thresholds based on your risk tolerance
- Keep a trading journal to track performance
---
## ⚠️ Disclaimer
This indicator is a tool for technical analysis and should not be used as the sole basis for trading decisions. Options trading involves substantial risk and is not suitable for all investors. Past performance does not guarantee future results. Always:
- Do your own research and due diligence
- Never invest more than you can afford to lose
- Consider consulting with a financial advisor
- Practice with paper trading before using real money
- Understand options Greeks (Delta, Theta, Gamma, Vega)
- Be aware of earnings dates and major news events
**No indicator is 100% accurate. Use proper risk management and trade responsibly.**
---
## 📊 Version History
**v1.0 - Initial Release**
- Multi-signal confluence system
- 10+ technical indicators
- Advanced dashboard
- ATR-based risk management
- Comprehensive alert system
---
## 🎯 Final Thoughts
**Apex Options Sniper** transforms complex technical analysis into clear, actionable signals. By combining multiple proven indicators with sophisticated scoring logic, it helps traders identify high-probability setups while managing risk effectively.
**Success Keys:**
- Quality over quantity (be selective)
- Risk management is everything
- Volume confirms the signal
- Confluence increases probability
- Discipline beats emotion
**Trade smart. Trade with confidence. Trade with Apex Options Sniper.**
---
*For questions, suggestions, or to share your success stories, please comment below or send a message.*
**Happy Trading! 🚀📈**
